

The external fund manager backed by Berkshire Hathaway's Charlie Munger, Li Lu, makes no bones about it when he says 'The biggest investment risk is not the volatility of prices, but whether you will suffer a permanent loss of capital.' So it might be obvious that you need to consider debt, when you think about how risky any given stock is, because too much debt can sink a company. We can see that Movinn A/S (CPH:MOVINN) does use debt in its business. But the more important question is: how much risk is that debt creating?
Why Does Debt Bring Risk?
Debt assists a business until the business has trouble paying it off, either with new capital or with free cash flow. Part and parcel of capitalism is the process of 'creative destruction' where failed businesses are mercilessly liquidated by their bankers. However, a more common (but still painful) scenario is that it has to raise new equity capital at a low price, thus permanently diluting shareholders. Of course, plenty of companies use debt to fund growth, without any negative consequences. The first thing to do when considering how much debt a business uses is to look at its cash and debt together.
Check out our latest analysis for Movinn
How Much Debt Does Movinn Carry?
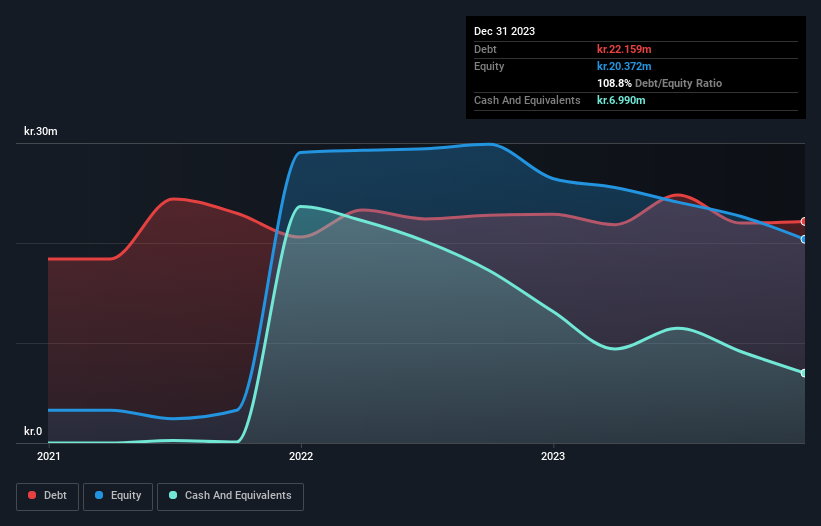
As you can see below, Movinn had kr.22.2m of debt, at December 2023, which is about the same as the year before. You can click the chart for greater detail. On the flip side, it has kr.6.99m in cash leading to net debt of about kr.15.2m.
How Strong Is Movinn's Balance Sheet?
Zooming in on the latest balance sheet data, we can see that Movinn had liabilities of kr.13.0m due within 12 months and liabilities of kr.19.9m due beyond that. On the other hand, it had cash of kr.6.99m and kr.2.60m worth of receivables due within a year. So it has liabilities totalling kr.23.3m more than its cash and near-term receivables, combined.
While this might seem like a lot, it is not so bad since Movinn has a market capitalization of kr.41.8m, and so it could probably strengthen its balance sheet by raising capital if it needed to. But it's clear that we should definitely closely examine whether it can manage its debt without dilution. There's no doubt that we learn most about debt from the balance sheet. But it is Movinn's earnings that will influence how the balance sheet holds up in the future. So if you're keen to discover more about its earnings, it might be worth checking out this graph of its long term earnings trend.
Over 12 months, Movinn reported revenue of kr.84m, which is a gain of 14%, although it did not report any earnings before interest and tax. We usually like to see faster growth from unprofitable companies, but each to their own.
Caveat Emptor
Importantly, Movinn had an earnings before interest and tax (EBIT) loss over the last year. Its EBIT loss was a whopping kr.6.0m. Considering that alongside the liabilities mentioned above does not give us much confidence that company should be using so much debt. So we think its balance sheet is a little strained, though not beyond repair. Another cause for caution is that is bled kr.4.8m in negative free cash flow over the last twelve months. So in short it's a really risky stock. The balance sheet is clearly the area to focus on when you are analysing debt. However, not all investment risk resides within the balance sheet - far from it. For example - Movinn has 3 warning signs we think you should be aware of.
If you're interested in investing in businesses that can grow profits without the burden of debt, then check out this free list of growing businesses that have net cash on the balance sheet.
If you're looking to trade Movinn, open an account with the lowest-cost platform trusted by professionals, Interactive Brokers.
With clients in over 200 countries and territories, and access to 160 markets, IBKR lets you trade stocks, options, futures, forex, bonds and funds from a single integrated account.
Enjoy no hidden fees, no account minimums, and FX conversion rates as low as 0.03%, far better than what most brokers offer.
Sponsored ContentNew: Manage All Your Stock Portfolios in One Place
We've created the ultimate portfolio companion for stock investors, and it's free.
• Connect an unlimited number of Portfolios and see your total in one currency
• Be alerted to new Warning Signs or Risks via email or mobile
• Track the Fair Value of your stocks
Have feedback on this article? Concerned about the content? Get in touch with us directly. Alternatively, email editorial-team (at) simplywallst.com.
This article by Simply Wall St is general in nature. We provide commentary based on historical data and analyst forecasts only using an unbiased methodology and our articles are not intended to be financial advice. It does not constitute a recommendation to buy or sell any stock, and does not take account of your objectives, or your financial situation. We aim to bring you long-term focused analysis driven by fundamental data. Note that our analysis may not factor in the latest price-sensitive company announcements or qualitative material. Simply Wall St has no position in any stocks mentioned.
About CPSE:MOVINN
Movinn
Provides furnished and serviced accommodation in Denmark and Sweden.
Low and slightly overvalued.
Similar Companies
Market Insights

Community Narratives


