Advertisement
Are Genmab Shares Attractive After Strong Rally and New Takeda Collaboration in 2025?

Simply Wall St
Reviewed by Bailey Pemberton
Thinking about whether to buy, hold, or sell Genmab? You are not alone. With biotech names like Genmab, the decision can feel tricky, especially with the stock’s recent rally. Over the past month, Genmab has surged 15.5%, contributing to a strong year-to-date return of 33.5%. The company’s one-year return is also up 27.4%, signaling investors are warming up to its long-term prospects. Yet, if you look back further, you will notice that Genmab shares are still lagging over three and five years, down 27.6% and 12.9% respectively, reflecting the volatile nature of the biotech sector and how quickly sentiment can shift.
Despite the market’s up-and-down relationship with Genmab, the fundamentals are telling a more encouraging story. Recent market movements, including shifts in sentiment toward biotech innovation and global regulatory changes, have played a role in the renewed optimism for Genmab’s pipeline. Is that justified, or have investors gotten ahead of themselves?
To make sense of the numbers, Genmab currently boasts a value score of 5 out of 6. In plain English, this means the company is undervalued across nearly every key metric analysts use to grade stocks. But does that mean Genmab is a screaming buy, or should we still tread carefully? Next, we will break down exactly how those valuation checks are stacking up. Stick with me until the end, because there is an even smarter approach to valuation that you will not want to miss.
Approach 1: Genmab Discounted Cash Flow (DCF) Analysis
The Discounted Cash Flow (DCF) model valuates a company by projecting its future cash flows and discounting them back to today’s value, creating a present-day estimate based on expectations for how much money the business will generate over the years ahead.
For Genmab, the most recent reported Free Cash Flow stands at $1.06 Billion, and analysts anticipate continued growth over the coming years. By 2029, projections put Genmab’s Free Cash Flow at $2.33 Billion. These estimates make use of both analyst coverage for the next five years and extrapolations beyond that period, aiming to paint a fuller picture of Genmab’s potential.
When all these future cash flows are discounted back to today, the DCF model calculates an intrinsic value of $5,325 per share. Comparing this to the current market valuation, Genmab appears to be trading at a significant 61.6% discount to its estimated fair value, which suggests the stock is deeply undervalued by the market right now.
Result: UNDERVALUED
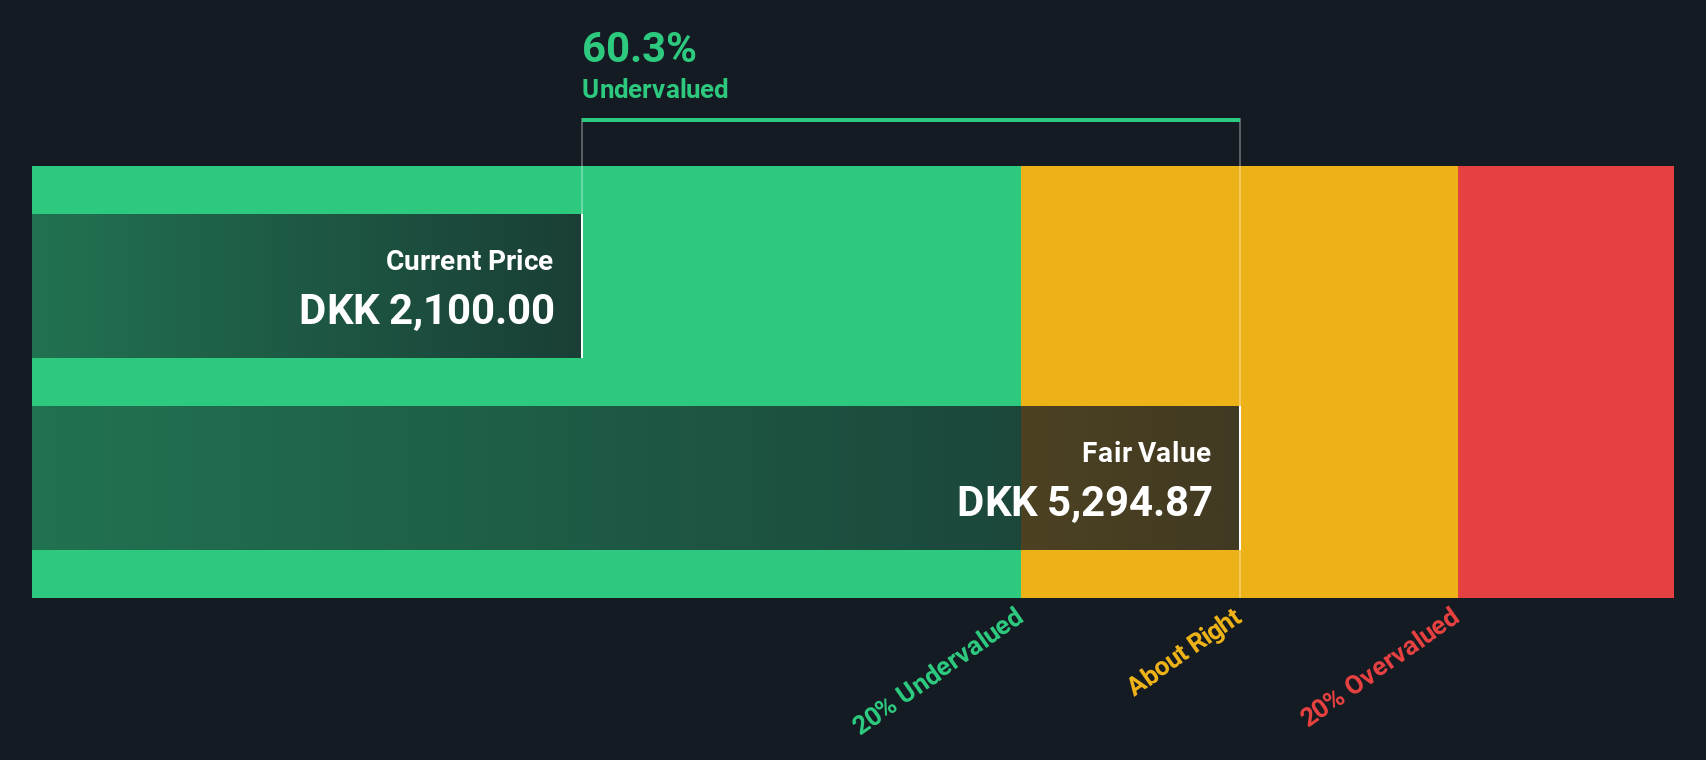
Our Discounted Cash Flow (DCF) analysis suggests Genmab is undervalued by 61.6%. Track this in your watchlist or portfolio, or discover more undervalued stocks.
Approach 2: Genmab Price vs Earnings
For profitable companies like Genmab, the Price-to-Earnings (PE) ratio is one of the most commonly used ways to assess valuation. The PE ratio allows investors to gauge how much they are paying for each unit of company earnings, making it especially suitable for mature companies with positive and stable profits.
Companies with higher growth prospects or lower perceived risk tend to command higher PE ratios, while those with sluggish growth or higher risk often trade at lower multiples. What counts as a “normal” PE ratio varies by industry, growth rate, profitability, and market sentiment.
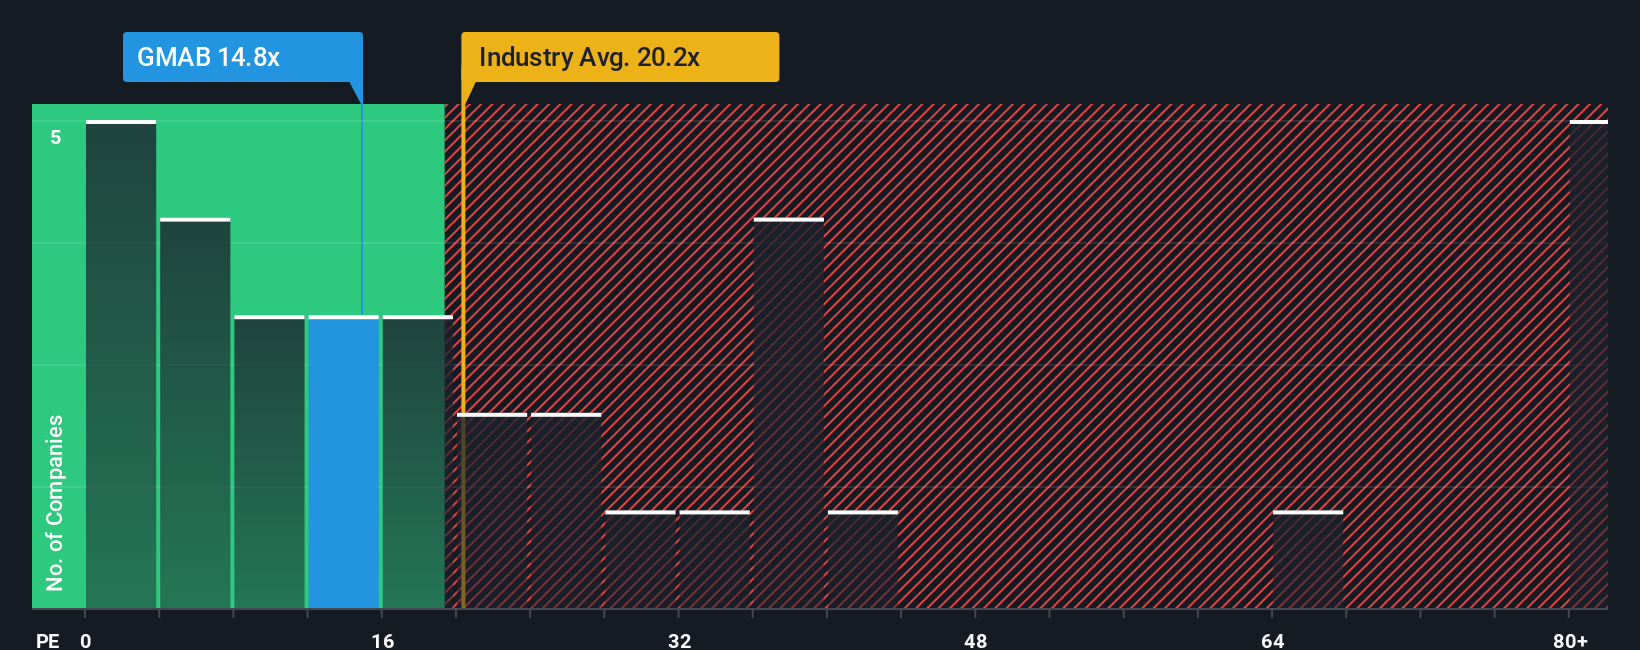
Genmab currently trades at a PE ratio of 14.27x. This is notably below the biotech industry average of 30.16x, and also less than its peer average of 19.59x. At first glance, that looks like a significant discount. However, a simple comparison to the sector or peer group may not tell the whole story.
This is where Simply Wall St’s Fair Ratio comes in. The Fair Ratio, currently at 18.46x for Genmab, reflects an optimal multiple based on the company’s specific growth outlook, risk profile, profit margins, industry trends, and even its market cap. This makes Fair Ratio a more accurate benchmark than simply using broad averages, which can miss important company-specific dynamics.
With Genmab’s actual PE of 14.27x sitting noticeably below its Fair Ratio of 18.46x, the stock appears to be undervalued on this metric as well.
Result: UNDERVALUED
PE ratios tell one story, but what if the real opportunity lies elsewhere? Discover companies where insiders are betting big on explosive growth.
Upgrade Your Decision Making: Choose your Genmab Narrative
Earlier, we mentioned that there is an even better way to understand valuation. Let’s introduce you to Narratives. A Narrative is your personal investment story for Genmab, connecting the company’s real-world developments such as pipeline progress or competition to your estimates for its future revenue, earnings, and margins, resulting in your own fair value calculation.
Unlike static ratios, a Narrative puts your expectations front and center. It allows you to clearly see how the story you believe will play out translates into actual numbers and a fair value. This approach is fast, approachable, and available to everyone on the Simply Wall St platform, where millions of investors share their Narratives and transparent forecasts on the Community page.
With Narratives, you can easily compare your calculated fair value against Genmab’s current share price, making it much simpler to spot buy or sell opportunities. Each Narrative is also updated live as new earnings, news, or regulatory events hit the market, ensuring your investment thesis never falls out of date.
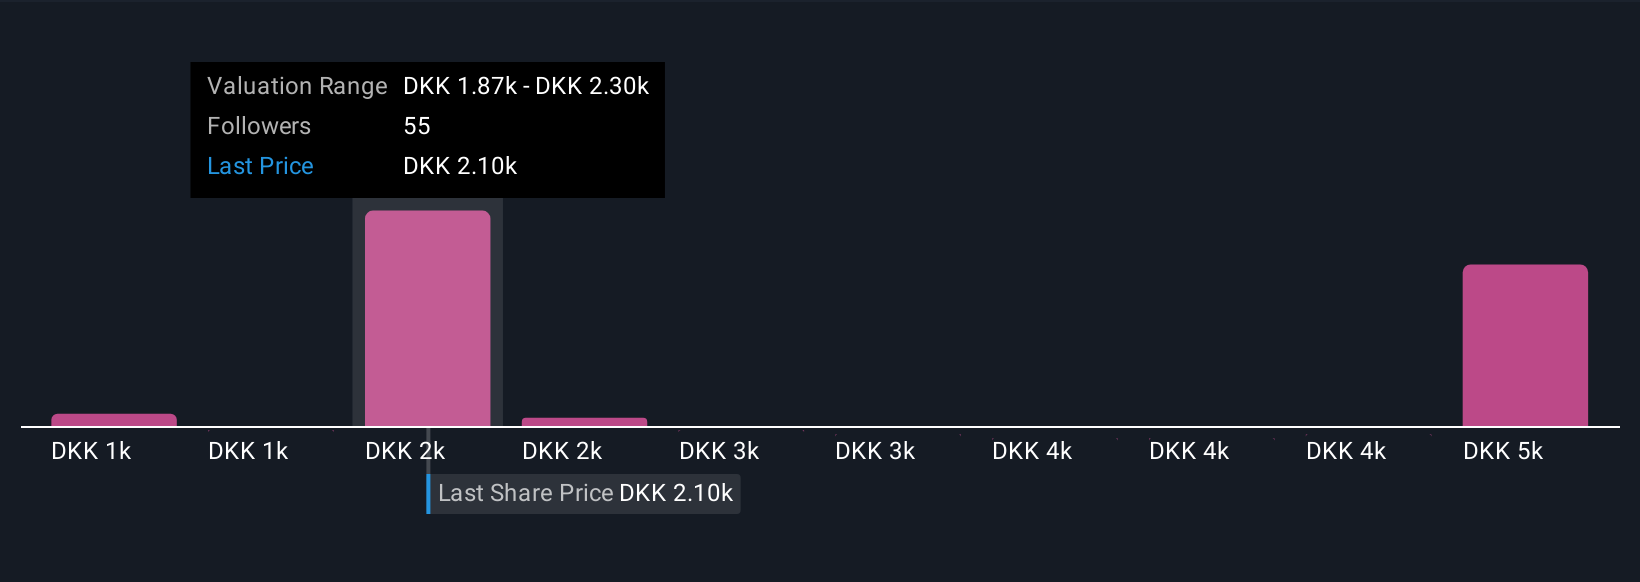
For example, the most bullish Narrative for Genmab sees significant pipeline advances and global expansion driving earnings as high as $2.2 billion in the next few years. The most cautious Outlook envisages just $1.4 billion in earnings, highlighting how different stories and assumptions can lead to widely different fair values for the same company.
Do you think there's more to the story for Genmab? Create your own Narrative to let the Community know!
This article by Simply Wall St is general in nature. We provide commentary based on historical data and analyst forecasts only using an unbiased methodology and our articles are not intended to be financial advice. It does not constitute a recommendation to buy or sell any stock, and does not take account of your objectives, or your financial situation. We aim to bring you long-term focused analysis driven by fundamental data. Note that our analysis may not factor in the latest price-sensitive company announcements or qualitative material. Simply Wall St has no position in any stocks mentioned.
New: Manage All Your Stock Portfolios in One Place
We've created the ultimate portfolio companion for stock investors, and it's free.
• Connect an unlimited number of Portfolios and see your total in one currency
• Be alerted to new Warning Signs or Risks via email or mobile
• Track the Fair Value of your stocks
Have feedback on this article? Concerned about the content? Get in touch with us directly. Alternatively, email editorial-team@simplywallst.com
About CPSE:GMAB
Genmab
A biotechnology company, develops antibody-based products and product candidates for the treatment of cancer and other diseases in Denmark.
Flawless balance sheet and undervalued.
Similar Companies
Market Insights

Advertisement
Community Narratives
A formidable player in AI and enterprise computing.
Fair Value US$210.00|12.2% overvalued
CO
Community Contributor
IREN's Bold Moves in Sustainable Bitcoin Mining & AI Data Centers
Fair Value US$72.52|17.1% undervalued
BL
Community Contributor
Cooling the Champions: The Aussie Tech Behind F1's Victories
Fair Value AU$12.40|38.7% undervalued
TR
Community Contributor