

Today we'll do a simple run through of a valuation method used to estimate the attractiveness of Coloplast A/S (CPH:COLO B) as an investment opportunity by projecting its future cash flows and then discounting them to today's value. The Discounted Cash Flow (DCF) model is the tool we will apply to do this. Believe it or not, it's not too difficult to follow, as you'll see from our example!
Companies can be valued in a lot of ways, so we would point out that a DCF is not perfect for every situation. For those who are keen learners of equity analysis, the Simply Wall St analysis model here may be something of interest to you.
Check out our latest analysis for Coloplast
What's the estimated valuation?
We use what is known as a 2-stage model, which simply means we have two different periods of growth rates for the company's cash flows. Generally the first stage is higher growth, and the second stage is a lower growth phase. To begin with, we have to get estimates of the next ten years of cash flows. Where possible we use analyst estimates, but when these aren't available we extrapolate the previous free cash flow (FCF) from the last estimate or reported value. We assume companies with shrinking free cash flow will slow their rate of shrinkage, and that companies with growing free cash flow will see their growth rate slow, over this period. We do this to reflect that growth tends to slow more in the early years than it does in later years.
A DCF is all about the idea that a dollar in the future is less valuable than a dollar today, and so the sum of these future cash flows is then discounted to today's value:
10-year free cash flow (FCF) forecast
| 2022 | 2023 | 2024 | 2025 | 2026 | 2027 | 2028 | 2029 | 2030 | 2031 | |
| Levered FCF (DKK, Millions) | kr.4.74b | kr.5.29b | kr.6.04b | kr.6.87b | kr.7.45b | kr.7.88b | kr.8.21b | kr.8.45b | kr.8.63b | kr.8.76b |
| Growth Rate Estimate Source | Analyst x11 | Analyst x10 | Analyst x4 | Analyst x3 | Est @ 8.36% | Est @ 5.88% | Est @ 4.15% | Est @ 2.94% | Est @ 2.09% | Est @ 1.5% |
| Present Value (DKK, Millions) Discounted @ 4.0% | kr.4.6k | kr.4.9k | kr.5.4k | kr.5.9k | kr.6.1k | kr.6.2k | kr.6.2k | kr.6.2k | kr.6.1k | kr.5.9k |
("Est" = FCF growth rate estimated by Simply Wall St)
Present Value of 10-year Cash Flow (PVCF) = kr.57b
The second stage is also known as Terminal Value, this is the business's cash flow after the first stage. The Gordon Growth formula is used to calculate Terminal Value at a future annual growth rate equal to the 5-year average of the 10-year government bond yield of 0.1%. We discount the terminal cash flows to today's value at a cost of equity of 4.0%.
Terminal Value (TV)= FCF2031 × (1 + g) ÷ (r – g) = kr.8.8b× (1 + 0.1%) ÷ (4.0%– 0.1%) = kr.225b
Present Value of Terminal Value (PVTV)= TV / (1 + r)10= kr.225b÷ ( 1 + 4.0%)10= kr.152b
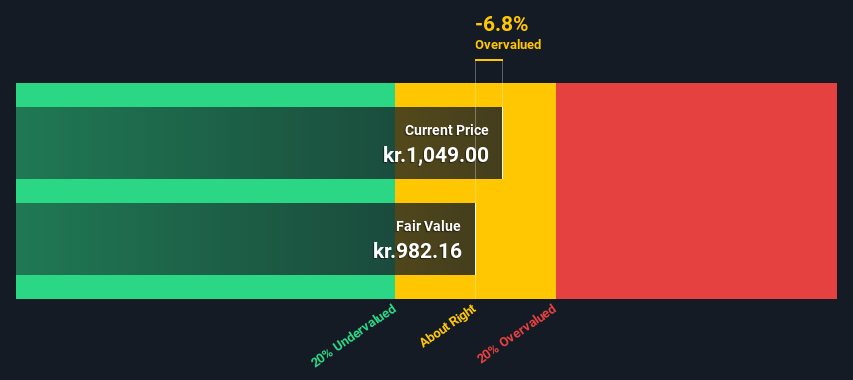
The total value is the sum of cash flows for the next ten years plus the discounted terminal value, which results in the Total Equity Value, which in this case is kr.209b. In the final step we divide the equity value by the number of shares outstanding. Relative to the current share price of kr.1.0k, the company appears around fair value at the time of writing. Valuations are imprecise instruments though, rather like a telescope - move a few degrees and end up in a different galaxy. Do keep this in mind.
Important assumptions
We would point out that the most important inputs to a discounted cash flow are the discount rate and of course the actual cash flows. Part of investing is coming up with your own evaluation of a company's future performance, so try the calculation yourself and check your own assumptions. The DCF also does not consider the possible cyclicality of an industry, or a company's future capital requirements, so it does not give a full picture of a company's potential performance. Given that we are looking at Coloplast as potential shareholders, the cost of equity is used as the discount rate, rather than the cost of capital (or weighted average cost of capital, WACC) which accounts for debt. In this calculation we've used 4.0%, which is based on a levered beta of 0.891. Beta is a measure of a stock's volatility, compared to the market as a whole. We get our beta from the industry average beta of globally comparable companies, with an imposed limit between 0.8 and 2.0, which is a reasonable range for a stable business.
Moving On:
Although the valuation of a company is important, it ideally won't be the sole piece of analysis you scrutinize for a company. The DCF model is not a perfect stock valuation tool. Rather it should be seen as a guide to "what assumptions need to be true for this stock to be under/overvalued?" If a company grows at a different rate, or if its cost of equity or risk free rate changes sharply, the output can look very different. For Coloplast, we've put together three additional elements you should assess:
- Risks: As an example, we've found 1 warning sign for Coloplast that you need to consider before investing here.
- Future Earnings: How does COLO B's growth rate compare to its peers and the wider market? Dig deeper into the analyst consensus number for the upcoming years by interacting with our free analyst growth expectation chart.
- Other Solid Businesses: Low debt, high returns on equity and good past performance are fundamental to a strong business. Why not explore our interactive list of stocks with solid business fundamentals to see if there are other companies you may not have considered!
PS. The Simply Wall St app conducts a discounted cash flow valuation for every stock on the CPSE every day. If you want to find the calculation for other stocks just search here.
If you're looking to trade Coloplast, open an account with the lowest-cost platform trusted by professionals, Interactive Brokers.
With clients in over 200 countries and territories, and access to 160 markets, IBKR lets you trade stocks, options, futures, forex, bonds and funds from a single integrated account.
Enjoy no hidden fees, no account minimums, and FX conversion rates as low as 0.03%, far better than what most brokers offer.
Sponsored ContentNew: AI Stock Screener & Alerts
Our new AI Stock Screener scans the market every day to uncover opportunities.
• Dividend Powerhouses (3%+ Yield)
• Undervalued Small Caps with Insider Buying
• High growth Tech and AI Companies
Or build your own from over 50 metrics.
This article by Simply Wall St is general in nature. We provide commentary based on historical data and analyst forecasts only using an unbiased methodology and our articles are not intended to be financial advice. It does not constitute a recommendation to buy or sell any stock, and does not take account of your objectives, or your financial situation. We aim to bring you long-term focused analysis driven by fundamental data. Note that our analysis may not factor in the latest price-sensitive company announcements or qualitative material. Simply Wall St has no position in any stocks mentioned.
Have feedback on this article? Concerned about the content? Get in touch with us directly. Alternatively, email editorial-team (at) simplywallst.com.
About CPSE:COLO B
Coloplast
Engages in the development and sale of intimate healthcare products and services in Denmark, the United States, the United Kingdom, France, and internationally.
Undervalued with moderate growth potential.
Similar Companies
Market Insights

Community Narratives


