
Advertisement
Should You Be Tempted To Sell FLSmidth & Co. A/S (CPH:FLS) Because Of Its P/E Ratio?
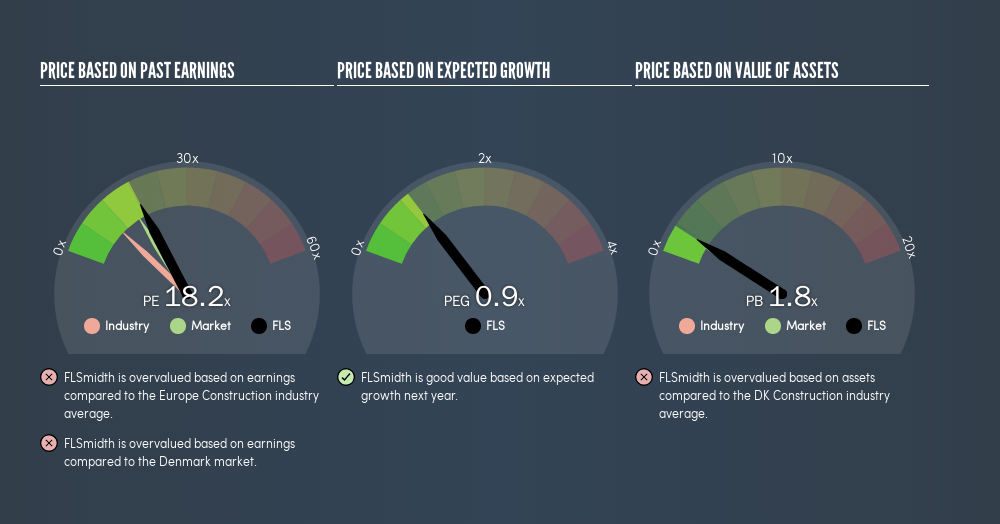
The goal of this article is to teach you how to use price to earnings ratios (P/E ratios). We'll show how you can use FLSmidth & Co. A/S's (CPH:FLS) P/E ratio to inform your assessment of the investment opportunity. FLSmidth has a P/E ratio of 18.23, based on the last twelve months. That corresponds to an earnings yield of approximately 5.5%.
View our latest analysis for FLSmidth
How Do I Calculate FLSmidth's Price To Earnings Ratio?
The formula for P/E is:
Price to Earnings Ratio = Price per Share ÷ Earnings per Share (EPS)
Or for FLSmidth:
P/E of 18.23 = DKK299.9 ÷ DKK16.45 (Based on the trailing twelve months to December 2018.)
Is A High Price-to-Earnings Ratio Good?
A higher P/E ratio means that investors are paying a higher price for each DKK1 of company earnings. That isn't necessarily good or bad, but a high P/E implies relatively high expectations of what a company can achieve in the future.
How Growth Rates Impact P/E Ratios
Earnings growth rates have a big influence on P/E ratios. That's because companies that grow earnings per share quickly will rapidly increase the 'E' in the equation. That means unless the share price increases, the P/E will reduce in a few years. So while a stock may look expensive based on past earnings, it could be cheap based on future earnings.
Notably, FLSmidth grew EPS by a whopping 93% in the last year. And its annual EPS growth rate over 5 years is 22%. With that performance, I would expect it to have an above average P/E ratio.
How Does FLSmidth's P/E Ratio Compare To Its Peers?
The P/E ratio indicates whether the market has higher or lower expectations of a company. The image below shows that FLSmidth has a higher P/E than the average (10.2) P/E for companies in the construction industry.
Its relatively high P/E ratio indicates that FLSmidth shareholders think it will perform better than other companies in its industry classification. Clearly the market expects growth, but it isn't guaranteed. So investors should delve deeper. I like to check if company insiders have been buying or selling.
A Limitation: P/E Ratios Ignore Debt and Cash In The Bank
Don't forget that the P/E ratio considers market capitalization. Thus, the metric does not reflect cash or debt held by the company. Hypothetically, a company could reduce its future P/E ratio by spending its cash (or taking on debt) to achieve higher earnings.
Such spending might be good or bad, overall, but the key point here is that you need to look at debt to understand the P/E ratio in context.
Is Debt Impacting FLSmidth's P/E?
FLSmidth's net debt is 13% of its market cap. That's enough debt to impact the P/E ratio a little; so keep it in mind if you're comparing it to companies without debt.
The Bottom Line On FLSmidth's P/E Ratio
FLSmidth's P/E is 18.2 which is about average (17) in the DK market. When you consider the impressive EPS growth last year (along with some debt), it seems the market has questions about whether rapid EPS growth will be sustained. Given analysts are expecting further growth, one might have expected a higher P/E ratio. That may be worth further research.
Investors have an opportunity when market expectations about a stock are wrong. People often underestimate remarkable growth -- so investors can make money when fast growth is not fully appreciated. So this freevisual report on analyst forecasts could hold the key to an excellent investment decision.
Of course you might be able to find a better stock than FLSmidth. So you may wish to see this freecollection of other companies that have grown earnings strongly.
We aim to bring you long-term focused research analysis driven by fundamental data. Note that our analysis may not factor in the latest price-sensitive company announcements or qualitative material.
If you spot an error that warrants correction, please contact the editor at editorial-team@simplywallst.com. This article by Simply Wall St is general in nature. It does not constitute a recommendation to buy or sell any stock, and does not take account of your objectives, or your financial situation. Simply Wall St has no position in the stocks mentioned. Thank you for reading.
About CPSE:FLS
FLSmidth
Provides flowsheet technology and service solutions for the mining and cement industries in Denmark, the United States of America, Canada, Chile, Brazil, Peru, Australia, North and South America, Europe, the Middle East, Africa, and Asia.
Flawless balance sheet with solid track record.
Similar Companies
Market Insights

Advertisement
Community Narratives
A formidable player in AI and enterprise computing.
Fair Value US$210.00|10.9% overvalued
CO
Community Contributor
IREN's Bold Moves in Sustainable Bitcoin Mining & AI Data Centers
Fair Value US$72.52|12.0% undervalued
BL
Community Contributor
Cooling the Champions: The Aussie Tech Behind F1's Victories
Fair Value AU$12.40|38.7% undervalued
TR
Community Contributor