
Advertisement
- Germany
- /
- Infrastructure
- /
- XTRA:FRA
Should Fraport AG (ETR:FRA) Focus On Improving This Fundamental Metric?

While some investors are already well versed in financial metrics (hat tip), this article is for those who would like to learn about Return On Equity (ROE) and why it is important. To keep the lesson grounded in practicality, we'll use ROE to better understand Fraport AG (ETR:FRA).
Return on Equity or ROE is a test of how effectively a company is growing its value and managing investors’ money. In short, ROE shows the profit each dollar generates with respect to its shareholder investments.
Check out our latest analysis for Fraport
How Do You Calculate Return On Equity?
ROE can be calculated by using the formula:
Return on Equity = Net Profit (from continuing operations) ÷ Shareholders' Equity
So, based on the above formula, the ROE for Fraport is:
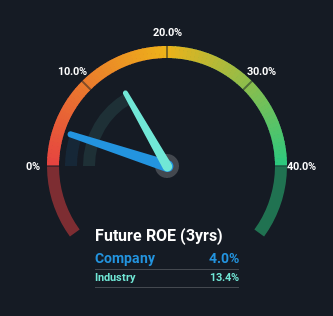
4.0% = €167m ÷ €4.1b (Based on the trailing twelve months to December 2022).
The 'return' is the income the business earned over the last year. That means that for every €1 worth of shareholders' equity, the company generated €0.04 in profit.
Does Fraport Have A Good Return On Equity?
Arguably the easiest way to assess company's ROE is to compare it with the average in its industry. Importantly, this is far from a perfect measure, because companies differ significantly within the same industry classification. If you look at the image below, you can see Fraport has a lower ROE than the average (13%) in the Infrastructure industry classification.
Unfortunately, that's sub-optimal. However, a low ROE is not always bad. If the company's debt levels are moderate to low, then there's still a chance that returns can be improved via the use of financial leverage. A high debt company having a low ROE is a different story altogether and a risky investment in our books. Our risks dashboard should have the 2 risks we have identified for Fraport.
Why You Should Consider Debt When Looking At ROE
Most companies need money -- from somewhere -- to grow their profits. That cash can come from retained earnings, issuing new shares (equity), or debt. In the first and second cases, the ROE will reflect this use of cash for investment in the business. In the latter case, the debt used for growth will improve returns, but won't affect the total equity. That will make the ROE look better than if no debt was used.
Combining Fraport's Debt And Its 4.0% Return On Equity
It's worth noting the high use of debt by Fraport, leading to its debt to equity ratio of 2.64. With a fairly low ROE, and significant use of debt, it's hard to get excited about this business at the moment. Debt increases risk and reduces options for the company in the future, so you generally want to see some good returns from using it.
Summary
Return on equity is useful for comparing the quality of different businesses. In our books, the highest quality companies have high return on equity, despite low debt. All else being equal, a higher ROE is better.
Having said that, while ROE is a useful indicator of business quality, you'll have to look at a whole range of factors to determine the right price to buy a stock. Profit growth rates, versus the expectations reflected in the price of the stock, are a particularly important to consider. So you might want to check this FREE visualization of analyst forecasts for the company.
If you would prefer check out another company -- one with potentially superior financials -- then do not miss this free list of interesting companies, that have HIGH return on equity and low debt.
New: AI Stock Screener & Alerts
Our new AI Stock Screener scans the market every day to uncover opportunities.
• Dividend Powerhouses (3%+ Yield)
• Undervalued Small Caps with Insider Buying
• High growth Tech and AI Companies
Or build your own from over 50 metrics.
Have feedback on this article? Concerned about the content? Get in touch with us directly. Alternatively, email editorial-team (at) simplywallst.com.
This article by Simply Wall St is general in nature. We provide commentary based on historical data and analyst forecasts only using an unbiased methodology and our articles are not intended to be financial advice. It does not constitute a recommendation to buy or sell any stock, and does not take account of your objectives, or your financial situation. We aim to bring you long-term focused analysis driven by fundamental data. Note that our analysis may not factor in the latest price-sensitive company announcements or qualitative material. Simply Wall St has no position in any stocks mentioned.
About XTRA:FRA
Fraport
Owns and operates airports in Germany, rest of Europe, Asia, and the United States.
Good value with proven track record.
Similar Companies
Market Insights

Advertisement
Community Narratives
Groundbreaking therapies that could change the treatment landscape for PTSD, fibromyalgia, MS & Alzheimer’s
Fair Value US$6.20|82.7% undervalued
CM
Community Contributor
DigitalOcean Will Grow 14% by Embracing AI with Paperspace Acquisition
Fair Value US$50.00|36.8% undervalued
NE
Community Contributor
Viant Technology: A Rising AdTech Challenger in the AI-Powered CTV Market
Fair Value US$38.61|61.4% undervalued
BL
Community Contributor
Volvo will Accelerate Forward into Electric and Autonomous Leadership in Five Years
Fair Value SEK 438.80|37.1% undervalued
UN
Community Contributor