- Germany
- /
- Wireless Telecom
- /
- XTRA:FNTN
freenet's (ETR:FNTN) investors will be pleased with their notable 83% return over the last three years


One simple way to benefit from the stock market is to buy an index fund. But many of us dare to dream of bigger returns, and build a portfolio ourselves. For example, the freenet AG (ETR:FNTN) share price is up 48% in the last three years, clearly besting the market decline of around 12% (not including dividends). On the other hand, the returns haven't been quite so good recently, with shareholders up just 24% , including dividends .
Let's take a look at the underlying fundamentals over the longer term, and see if they've been consistent with shareholders returns.
View our latest analysis for freenet
To quote Buffett, 'Ships will sail around the world but the Flat Earth Society will flourish. There will continue to be wide discrepancies between price and value in the marketplace...' One way to examine how market sentiment has changed over time is to look at the interaction between a company's share price and its earnings per share (EPS).
During the three years of share price growth, freenet actually saw its earnings per share (EPS) drop 10% per year.
This means it's unlikely the market is judging the company based on earnings growth. Since the change in EPS doesn't seem to correlate with the change in share price, it's worth taking a look at other metrics.
Interestingly, the dividend has increased over time; so that may have given the share price a boost. It could be that the company is reaching maturity and dividend investors are buying for the yield.
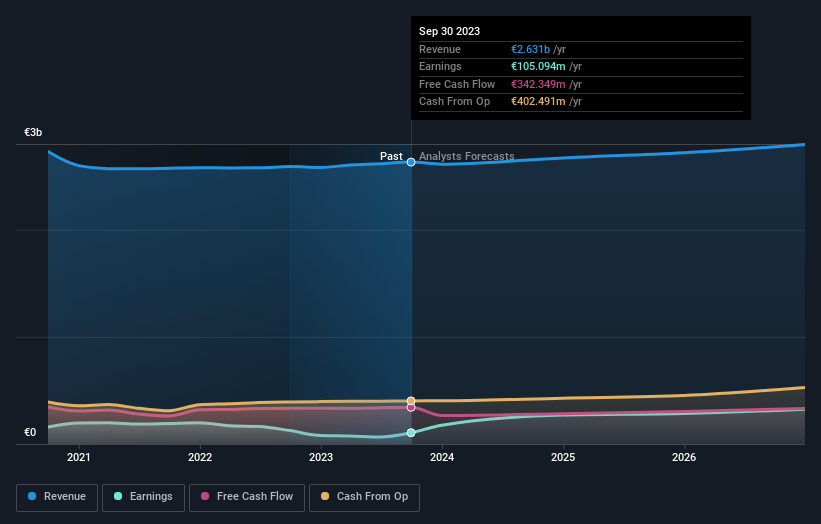
The company's revenue and earnings (over time) are depicted in the image below (click to see the exact numbers).
freenet is a well known stock, with plenty of analyst coverage, suggesting some visibility into future growth. Given we have quite a good number of analyst forecasts, it might be well worth checking out this free chart depicting consensus estimates.
What About Dividends?
It is important to consider the total shareholder return, as well as the share price return, for any given stock. Whereas the share price return only reflects the change in the share price, the TSR includes the value of dividends (assuming they were reinvested) and the benefit of any discounted capital raising or spin-off. Arguably, the TSR gives a more comprehensive picture of the return generated by a stock. As it happens, freenet's TSR for the last 3 years was 83%, which exceeds the share price return mentioned earlier. And there's no prize for guessing that the dividend payments largely explain the divergence!
A Different Perspective
We're pleased to report that freenet shareholders have received a total shareholder return of 24% over one year. That's including the dividend. Since the one-year TSR is better than the five-year TSR (the latter coming in at 13% per year), it would seem that the stock's performance has improved in recent times. In the best case scenario, this may hint at some real business momentum, implying that now could be a great time to delve deeper. It's always interesting to track share price performance over the longer term. But to understand freenet better, we need to consider many other factors. Even so, be aware that freenet is showing 1 warning sign in our investment analysis , you should know about...
If you are like me, then you will not want to miss this free list of growing companies that insiders are buying.
Please note, the market returns quoted in this article reflect the market weighted average returns of stocks that currently trade on German exchanges.
Valuation is complex, but we're here to simplify it.
Discover if freenet might be undervalued or overvalued with our detailed analysis, featuring fair value estimates, potential risks, dividends, insider trades, and its financial condition.
Access Free AnalysisHave feedback on this article? Concerned about the content? Get in touch with us directly. Alternatively, email editorial-team (at) simplywallst.com.
This article by Simply Wall St is general in nature. We provide commentary based on historical data and analyst forecasts only using an unbiased methodology and our articles are not intended to be financial advice. It does not constitute a recommendation to buy or sell any stock, and does not take account of your objectives, or your financial situation. We aim to bring you long-term focused analysis driven by fundamental data. Note that our analysis may not factor in the latest price-sensitive company announcements or qualitative material. Simply Wall St has no position in any stocks mentioned.
About XTRA:FNTN
freenet
Provides telecommunications, broadcasting, and multimedia services for mobile communications/mobile internet, and digital lifestyle sectors in Germany.
Undervalued with solid track record and pays a dividend.
Similar Companies
Market Insights

Community Narratives


