Advertisement
Should You Reconsider SAP After Its 10% Dip Despite Strong Cash Flow Growth?

Simply Wall St
Reviewed by Simply Wall St
Thinking about what to do with SAP stock right now? You are not alone. It is a question on the minds of investors everywhere, especially after a stretch of movement in the share price that might have you either excited or cautious. Over the past year, SAP delivered a total return of just over 21%, putting smiles on long-term holders’ faces. Go back even further, and three-year returns clock in at a remarkable 176%, so there is clearly a history of rewarding growth. That said, recent months have seen a shift. The past quarter shows a dip of about 10%, and the stock closed yesterday at €236.65, well below most analyst targets. So, what gives?
Part of the answer lies in how the market is viewing SAP’s growth prospects compared to the risks. Analysts still see plenty of upside, with the average price target about 21% higher than the current level. At the same time, SAP’s annual revenue and profit growth, at 11% and 16% respectively, continue to strengthen the investment case. But valuation is where things get really interesting. If we look at a score built from six different valuation checks, SAP only passes one, so its total is just 1 out of 6. That means, by most traditional measures, the stock does not exactly look like a screaming bargain, or does it?
To find out, let us break down how SAP stacks up by the numbers. We will walk through the usual valuation playbook, and as a hint, there is a more insightful approach to valuing SAP you will not want to miss at the end.
SAP delivered 21.1% returns over the last year. See how this stacks up to the rest of the Software industry.Approach 1: SAP Cash Flows
A Discounted Cash Flow (DCF) model works by estimating a company’s future cash flows and then discounting them back to today’s value, adjusting for risk and time. It is a tried-and-true way to assess what a stock may truly be worth, instead of just relying on current market price swings.
For SAP, current Free Cash Flow stands at approximately €6.3 billion, with anticipated growth each year. Looking ahead, analyst projections see annual FCF growing and reaching an estimated €12.85 billion by 2035. These rising numbers reflect strong expectations for SAP’s ability to generate cash over the coming decade.
Based on this outlook, the DCF estimate for SAP’s fair intrinsic value is €193.69 per share. Compared to yesterday’s close of €236.65, this model suggests SAP stock is trading at about 22.2% above its intrinsic value. In other words, it appears 22.2% overvalued on this metric.
Result: OVERVALUED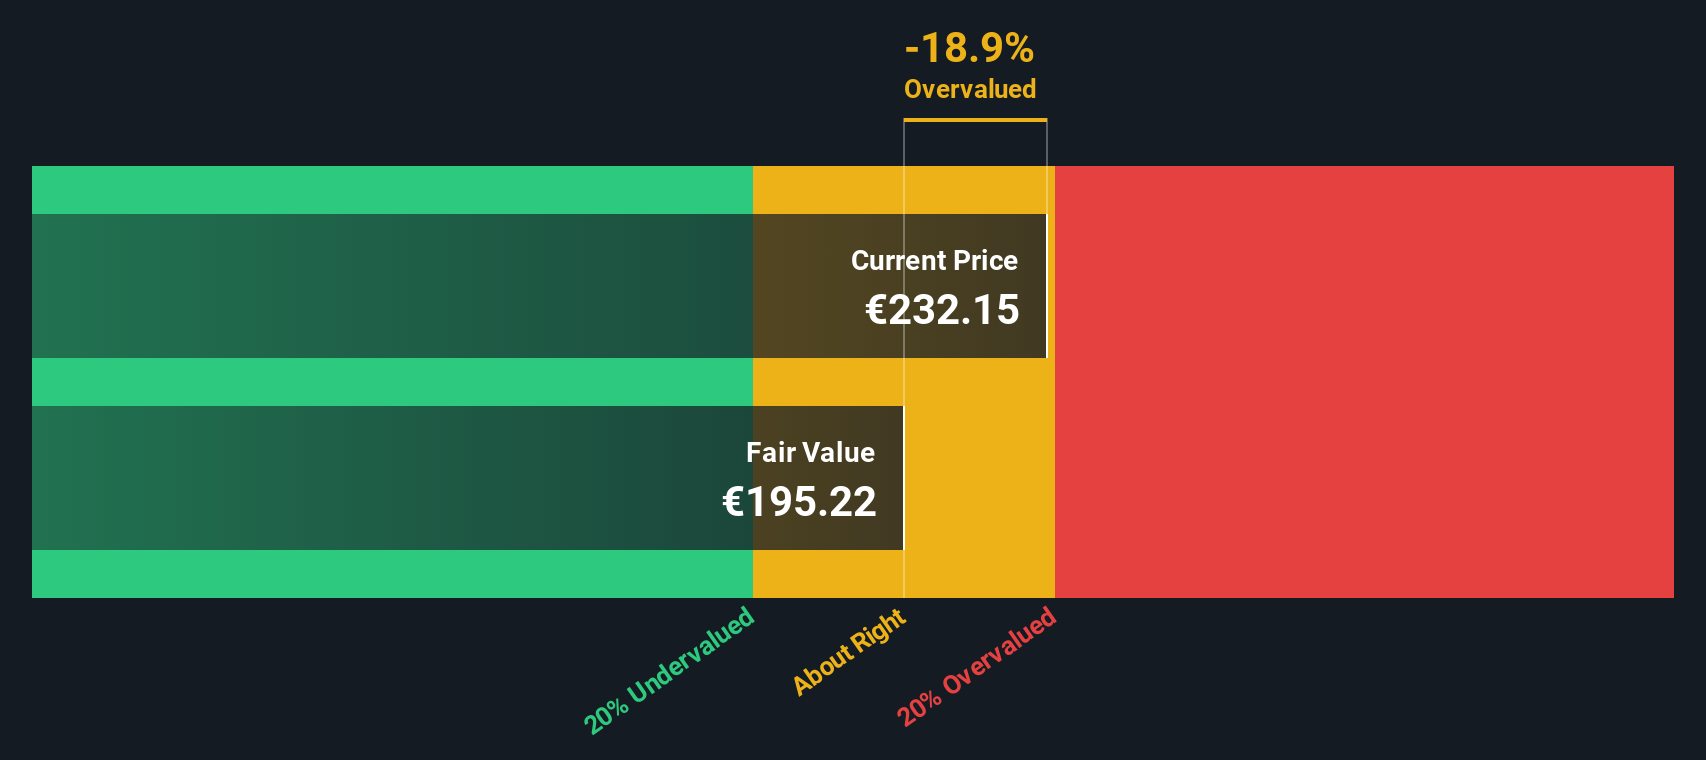
Approach 2: SAP Price vs Earnings
For profitable companies like SAP, the Price-to-Earnings (PE) ratio is a go-to metric in valuation discussions. It helps investors quickly gauge how much they are paying for each euro of current earnings, a crucial snapshot when the bottom line is in focus. PE is often favored because it blends both market optimism and company performance into a single, intuitive number.
Of course, what qualifies as a “fair” PE ratio can shift depending on factors like growth expectations and risk. Higher growth often justifies a higher multiple, while additional risks could reduce it. Context is everything when making these comparisons meaningful.
As it stands, SAP trades at a PE ratio of 42.13x. This is higher than the software industry average of 31.29x and also above the average across direct peers, which sits at 38.14x. Simply Wall St’s proprietary Fair Ratio model, which factors in SAP’s earnings growth and other fundamentals, suggests a fair PE of 40.83x for the stock right now. With SAP’s current PE only modestly above this fair value, the market seems to be pricing SAP about in line with expectations.
Result: ABOUT RIGHT
Upgrade Your Decision Making: Choose your SAP Narrative
Beyond traditional ratios, a Narrative is a simple but powerful way to make investment decisions by weaving your unique view of SAP’s story into the numbers. For example, this could include your best estimates for fair value, future revenue, earnings, and margins, all grounded in your perspective on the company’s journey and potential.
Narratives bridge the gap between what you believe about SAP’s business, whether it is on the brink of an AI-driven leap or facing tough competitive challenges, and what the future could look like in financial terms. This approach allows you to connect your story about SAP to a forecast and then to a fair value, highlighting where opportunities may exist.
On the Simply Wall St platform, Narratives are easy to create and share, giving investors of all levels a dynamic tool to overlay their outlook and instantly compare it with the community of millions. When new information appears, your Narrative is automatically updated, which helps you stay informed and make timely decisions about how your view of Fair Value compares to the current Price.
For example, right now, some investors see SAP’s future as justifying a fair value as high as €345.00, while others see it as low as €192.00. This demonstrates that there is no single story, but the Narrative you choose can help clarify your decisions.
Do you think there's more to the story for SAP? Create your own Narrative to let the Community know!
This article by Simply Wall St is general in nature. We provide commentary based on historical data and analyst forecasts only using an unbiased methodology and our articles are not intended to be financial advice. It does not constitute a recommendation to buy or sell any stock, and does not take account of your objectives, or your financial situation. We aim to bring you long-term focused analysis driven by fundamental data. Note that our analysis may not factor in the latest price-sensitive company announcements or qualitative material. Simply Wall St has no position in any stocks mentioned.
New: Manage All Your Stock Portfolios in One Place
We've created the ultimate portfolio companion for stock investors, and it's free.
• Connect an unlimited number of Portfolios and see your total in one currency
• Be alerted to new Warning Signs or Risks via email or mobile
• Track the Fair Value of your stocks
Have feedback on this article? Concerned about the content? Get in touch with us directly. Alternatively, email editorial-team@simplywallst.com
About XTRA:SAP
Flawless balance sheet with proven track record and pays a dividend.
Similar Companies
Market Insights


Advertisement
Community Narratives
Gaxos.ai: Early-Stage AI Innovator in Gaming & Health
Fair Value US$2.21|17.6% undervalued
JO
Community Contributor
After the AI Party: A Sobering Look at Microsoft's Future
Fair Value US$500.00|1.1% overvalued
PI
Community Contributor
Amazon's Future Rises as Stock Price Falls: A Long-Term Investment Vision
Fair Value US$234.75|4.7% undervalued
ZW
Community Contributor
