Advertisement
Is Now the Right Moment to Revisit SAP After Its 7% Surge This Week?

Simply Wall St
Reviewed by Simply Wall St
If you have been watching SAP, you are probably wondering whether now is the right moment to buy, hold, or perhaps even take some profits. After all, the stock has bounced around lately, offering reasons for both excitement and caution. In just the past week, SAP shares have climbed 7.2%, shaking off a sluggish start to the year where shares dipped 5.2% year-to-date and fell 2.8% over the past month. Still, if you zoom out a bit further, the company’s long-term trajectory speaks for itself, with an impressive 10.3% gain in the past twelve months and a 185.3% return over three years.
These moves are not happening in a vacuum. Recent industry chatter suggests that changing dynamics in the global software market are nudging investors to reconsider SAP’s growth potential and its role as a technology backbone for countless enterprises. In times like this, a focus on valuation becomes even more important, especially for a powerhouse like SAP, where expectations tend to run high regardless of recent dips or rallies.
Looking at the numbers, SAP scores a 2 out of 6 on our valuation scorecard, indicating that it is undervalued in two key areas but possibly priced at a premium in others. That raises the question: which valuation methods really matter here, and do they support a bullish or cautious take?
Up next, we will break down the main ways analysts judge SAP’s value, so stay tuned as a more nuanced approach to understanding the company’s real worth is waiting at the end of this analysis.
SAP scores just 2/6 on our valuation checks. See what other red flags we found in the full valuation breakdown.Approach 1: SAP Discounted Cash Flow (DCF) Analysis
The Discounted Cash Flow (DCF) model estimates a company’s value by forecasting its future cash flows and then discounting those figures back to their present value. This method is widely used because it takes into account the expected growth of a company and acknowledges the time value of money.
For SAP, the DCF analysis begins with its most recent twelve-month Free Cash Flow, which was €6.3 billion. Analysts predict this number will climb steadily, with estimates projecting Free Cash Flow to reach €11.4 billion by the end of 2027. Beyond that, further growth is expected based on extrapolations, and the DCF model tracks these rising cash flows over the next decade, using projections from both analyst forecasts and automated estimates for the later years.
After discounting these future billions in Free Cash Flow back to today, SAP’s estimated intrinsic value comes out to €244.05 per share. Compared to the current share price, this projection suggests SAP is 7.3% undervalued.
Result: ABOUT RIGHT
Head to the Valuation section of our Company Report for more details on how we arrive at this Fair Value for SAP.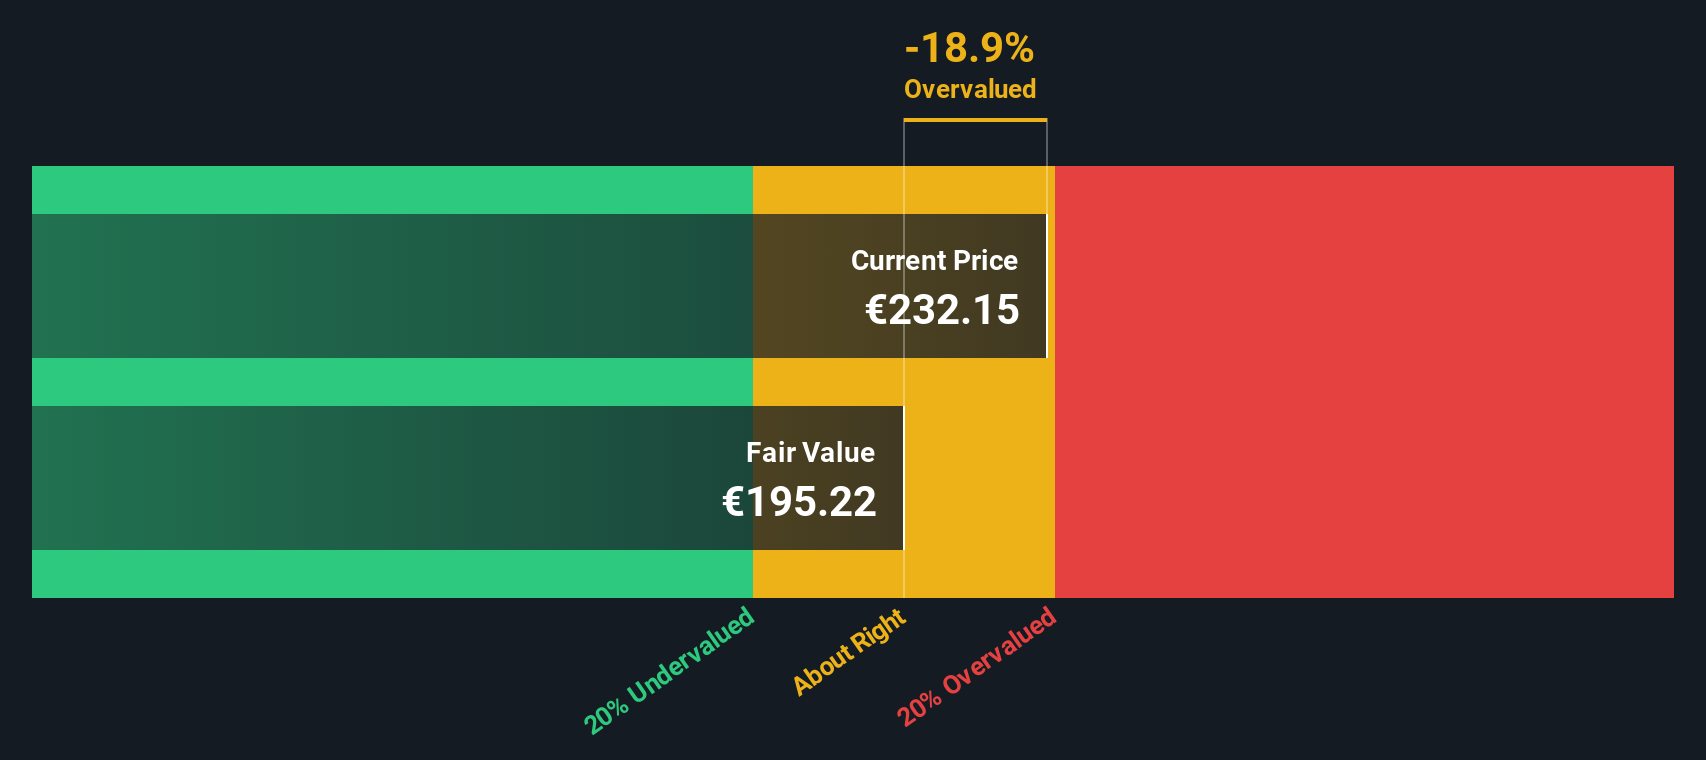
Approach 2: SAP Price vs Earnings (PE Ratio Analysis)
The Price-to-Earnings (PE) ratio is the preferred valuation metric for profitable companies like SAP because it puts current market price in the context of how much the company actually earns. For established businesses generating consistent profits, the PE ratio is an efficient shorthand for understanding what investors are willing to pay for each euro of earnings.
It’s important to remember that what qualifies as a “normal” or “fair” PE ratio depends on expectations for future growth and risk. Higher growth companies generally deserve higher PE ratios, as investors anticipate bigger future earnings. Meanwhile, more stable companies in mature markets often trade at lower multiples, reflecting steady but less spectacular growth prospects.
SAP’s current PE ratio stands at 40.27x. That is somewhat above both the software industry average of 31.29x and its peers, who average 37.78x. Taken at face value, this might suggest SAP is a bit more expensive than its peers.
This is where the concept of the Simply Wall St “Fair Ratio” comes in. Unlike a simple peer or industry comparison, the Fair Ratio (set at 39.43x for SAP) incorporates a much more holistic view, weighing the company’s earnings growth, risk profile, profit margins, size, and industry conditions. It is a more nuanced tool for judging fair value, especially for a global leader like SAP whose situation can differ meaningfully from a simple industry or peer group average.
Comparing SAP’s current PE of 40.27x with its Fair Ratio of 39.43x, the difference is less than a single multiple. That means SAP’s price tag is, by this measure, right in line with what its fundamentals and outlook suggest.
Result: ABOUT RIGHT

Upgrade Your Decision Making: Choose your SAP Narrative
Earlier, we mentioned there is an even better way to understand valuation, so let's introduce you to Narratives: easy, accessible storylines that let you map your perspective on a company like SAP. From your reasons for future growth to your estimates for earnings and margins, Narratives connect your thinking directly to a fair value calculation.
A Narrative goes beyond the numbers, connecting the company's story and your assumptions to a forward-looking financial forecast and then to a fair value so you can see whether SAP is worth buying, holding, or selling at today's price. Narratives are a feature on Simply Wall St’s Community page, used by millions of investors to quickly create or follow different investment theses, and they are dynamically updated as new news or earnings come in, so your view always stays relevant.
This approach helps you make smarter decisions by showing at a glance whether your fair value is above or below the current price, and allows you to compare your outlook with others in the community. For example, some investors believe SAP’s fair value is as high as €345 and are bullish about its AI opportunities, while others are cautious, setting fair value at €192 and focusing on competitive and regulatory risks.
Do you think there's more to the story for SAP? Create your own Narrative to let the Community know!
This article by Simply Wall St is general in nature. We provide commentary based on historical data and analyst forecasts only using an unbiased methodology and our articles are not intended to be financial advice. It does not constitute a recommendation to buy or sell any stock, and does not take account of your objectives, or your financial situation. We aim to bring you long-term focused analysis driven by fundamental data. Note that our analysis may not factor in the latest price-sensitive company announcements or qualitative material. Simply Wall St has no position in any stocks mentioned.
New: Manage All Your Stock Portfolios in One Place
We've created the ultimate portfolio companion for stock investors, and it's free.
• Connect an unlimited number of Portfolios and see your total in one currency
• Be alerted to new Warning Signs or Risks via email or mobile
• Track the Fair Value of your stocks
Have feedback on this article? Concerned about the content? Get in touch with us directly. Alternatively, email editorial-team@simplywallst.com
About XTRA:SAP
Flawless balance sheet with proven track record and pays a dividend.
Similar Companies
Market Insights

Advertisement
Community Narratives
A formidable player in AI and enterprise computing.
Fair Value US$210.00|12.2% overvalued
CO
Community Contributor
IREN's Bold Moves in Sustainable Bitcoin Mining & AI Data Centers
Fair Value US$72.52|17.1% undervalued
BL
Community Contributor
Cooling the Champions: The Aussie Tech Behind F1's Victories
Fair Value AU$12.40|38.7% undervalued
TR
Community Contributor