
Advertisement
ProSiebenSat.1 Media (ETR:PSM) sheds €56m, company earnings and investor returns have been trending downwards for past five years

Statistically speaking, long term investing is a profitable endeavour. But no-one is immune from buying too high. For example the ProSiebenSat.1 Media SE (ETR:PSM) share price dropped 75% over five years. That's an unpleasant experience for long term holders. And some of the more recent buyers are probably worried, too, with the stock falling 55% in the last year. Shareholders have had an even rougher run lately, with the share price down 19% in the last 90 days. Of course, this share price action may well have been influenced by the 9.4% decline in the broader market, throughout the period.
After losing 3.3% this past week, it's worth investigating the company's fundamentals to see what we can infer from past performance.
Though if you're not interested in researching what drove PSM's performance, we have a free list of interesting investing ideas to potentially inspire your next investment!
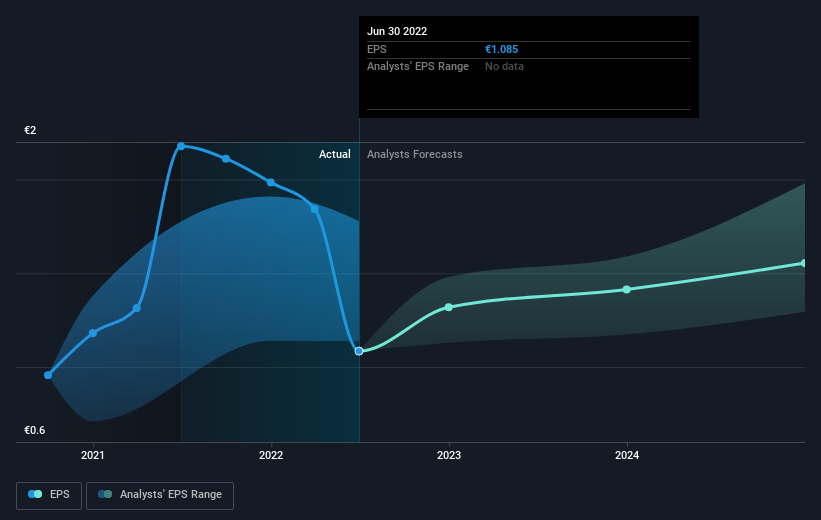
There is no denying that markets are sometimes efficient, but prices do not always reflect underlying business performance. One imperfect but simple way to consider how the market perception of a company has shifted is to compare the change in the earnings per share (EPS) with the share price movement.
During the five years over which the share price declined, ProSiebenSat.1 Media's earnings per share (EPS) dropped by 8.9% each year. This reduction in EPS is less than the 24% annual reduction in the share price. This implies that the market was previously too optimistic about the stock. The less favorable sentiment is reflected in its current P/E ratio of 6.12.
The graphic below depicts how EPS has changed over time (unveil the exact values by clicking on the image).
Before buying or selling a stock, we always recommend a close examination of historic growth trends, available here.
What About Dividends?
It is important to consider the total shareholder return, as well as the share price return, for any given stock. The TSR incorporates the value of any spin-offs or discounted capital raisings, along with any dividends, based on the assumption that the dividends are reinvested. So for companies that pay a generous dividend, the TSR is often a lot higher than the share price return. As it happens, ProSiebenSat.1 Media's TSR for the last 5 years was -68%, which exceeds the share price return mentioned earlier. This is largely a result of its dividend payments!
A Different Perspective
While the broader market lost about 26% in the twelve months, ProSiebenSat.1 Media shareholders did even worse, losing 51% (even including dividends). However, it could simply be that the share price has been impacted by broader market jitters. It might be worth keeping an eye on the fundamentals, in case there's a good opportunity. Regrettably, last year's performance caps off a bad run, with the shareholders facing a total loss of 11% per year over five years. Generally speaking long term share price weakness can be a bad sign, though contrarian investors might want to research the stock in hope of a turnaround. I find it very interesting to look at share price over the long term as a proxy for business performance. But to truly gain insight, we need to consider other information, too. For instance, we've identified 4 warning signs for ProSiebenSat.1 Media that you should be aware of.
But note: ProSiebenSat.1 Media may not be the best stock to buy. So take a peek at this free list of interesting companies with past earnings growth (and further growth forecast).
Please note, the market returns quoted in this article reflect the market weighted average returns of stocks that currently trade on DE exchanges.
New: Manage All Your Stock Portfolios in One Place
We've created the ultimate portfolio companion for stock investors, and it's free.
• Connect an unlimited number of Portfolios and see your total in one currency
• Be alerted to new Warning Signs or Risks via email or mobile
• Track the Fair Value of your stocks
Have feedback on this article? Concerned about the content? Get in touch with us directly. Alternatively, email editorial-team (at) simplywallst.com.
This article by Simply Wall St is general in nature. We provide commentary based on historical data and analyst forecasts only using an unbiased methodology and our articles are not intended to be financial advice. It does not constitute a recommendation to buy or sell any stock, and does not take account of your objectives, or your financial situation. We aim to bring you long-term focused analysis driven by fundamental data. Note that our analysis may not factor in the latest price-sensitive company announcements or qualitative material. Simply Wall St has no position in any stocks mentioned.
About XTRA:PSM
ProSiebenSat.1 Media
Operates as a media company in Germany, Austria, Switzerland, the United States, and internationally.
Undervalued with moderate growth potential.
Similar Companies
Market Insights


Advertisement
Community Narratives
The Future of Drug Testing? Fingerprint Tech Shows Serious Promise
Fair Value US$2.98|40.3% undervalued
JO
Community Contributor
Suncorp’s Next Chapter: Insurance-Only and Ready to Grow
Fair Value AU$22.83|7.9% undervalued
RO
Community Contributor
Thyssenkrupp Nucera Will Achieve Double-Digit Profits by 2030 Boosted by Hydrogen Growth
Fair Value €14.40|31.6% undervalued
CH
Community Contributor
Tesla’s Nvidia Moment – The AI & Robotics Inflection Point
Fair Value US$359.72|12.3% undervalued
BL
Community Contributor