- Germany
- /
- Healthcare Services
- /
- XTRA:FME
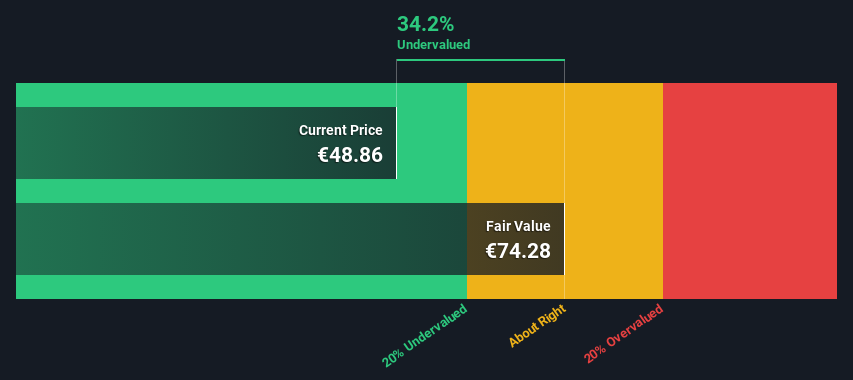
An Intrinsic Calculation For Fresenius Medical Care AG & Co. KGaA (ETR:FME) Suggests It's 34% Undervalued


Key Insights
- The projected fair value for Fresenius Medical Care KGaA is €74.28 based on 2 Stage Free Cash Flow to Equity
- Fresenius Medical Care KGaA is estimated to be 34% undervalued based on current share price of €48.86
- The €37.87 analyst price target for FME is 49% less than our estimate of fair value
How far off is Fresenius Medical Care AG & Co. KGaA (ETR:FME) from its intrinsic value? Using the most recent financial data, we'll take a look at whether the stock is fairly priced by projecting its future cash flows and then discounting them to today's value. We will take advantage of the Discounted Cash Flow (DCF) model for this purpose. Don't get put off by the jargon, the math behind it is actually quite straightforward.
Remember though, that there are many ways to estimate a company's value, and a DCF is just one method. For those who are keen learners of equity analysis, the Simply Wall St analysis model here may be something of interest to you.
See our latest analysis for Fresenius Medical Care KGaA
Crunching The Numbers
We use what is known as a 2-stage model, which simply means we have two different periods of growth rates for the company's cash flows. Generally the first stage is higher growth, and the second stage is a lower growth phase. To begin with, we have to get estimates of the next ten years of cash flows. Where possible we use analyst estimates, but when these aren't available we extrapolate the previous free cash flow (FCF) from the last estimate or reported value. We assume companies with shrinking free cash flow will slow their rate of shrinkage, and that companies with growing free cash flow will see their growth rate slow, over this period. We do this to reflect that growth tends to slow more in the early years than it does in later years.
A DCF is all about the idea that a dollar in the future is less valuable than a dollar today, so we need to discount the sum of these future cash flows to arrive at a present value estimate:
10-year free cash flow (FCF) forecast
| 2024 | 2025 | 2026 | 2027 | 2028 | 2029 | 2030 | 2031 | 2032 | 2033 | |
| Levered FCF (€, Millions) | €1.55b | €1.71b | €1.28b | €1.42b | €1.36b | €1.33b | €1.30b | €1.29b | €1.28b | €1.27b |
| Growth Rate Estimate Source | Analyst x10 | Analyst x10 | Analyst x3 | Analyst x2 | Est @ -3.92% | Est @ -2.67% | Est @ -1.80% | Est @ -1.19% | Est @ -0.76% | Est @ -0.46% |
| Present Value (€, Millions) Discounted @ 6.2% | €1.5k | €1.5k | €1.1k | €1.1k | €1.0k | €923 | €853 | €793 | €741 | €695 |
("Est" = FCF growth rate estimated by Simply Wall St)
Present Value of 10-year Cash Flow (PVCF) = €10b
The second stage is also known as Terminal Value, this is the business's cash flow after the first stage. For a number of reasons a very conservative growth rate is used that cannot exceed that of a country's GDP growth. In this case we have used the 5-year average of the 10-year government bond yield (0.2%) to estimate future growth. In the same way as with the 10-year 'growth' period, we discount future cash flows to today's value, using a cost of equity of 6.2%.
Terminal Value (TV)= FCF2033 × (1 + g) ÷ (r – g) = €1.3b× (1 + 0.2%) ÷ (6.2%– 0.2%) = €21b
Present Value of Terminal Value (PVTV)= TV / (1 + r)10= €21b÷ ( 1 + 6.2%)10= €12b
The total value is the sum of cash flows for the next ten years plus the discounted terminal value, which results in the Total Equity Value, which in this case is €22b. In the final step we divide the equity value by the number of shares outstanding. Relative to the current share price of €48.9, the company appears quite good value at a 34% discount to where the stock price trades currently. The assumptions in any calculation have a big impact on the valuation, so it is better to view this as a rough estimate, not precise down to the last cent.
The Assumptions
We would point out that the most important inputs to a discounted cash flow are the discount rate and of course the actual cash flows. If you don't agree with these result, have a go at the calculation yourself and play with the assumptions. The DCF also does not consider the possible cyclicality of an industry, or a company's future capital requirements, so it does not give a full picture of a company's potential performance. Given that we are looking at Fresenius Medical Care KGaA as potential shareholders, the cost of equity is used as the discount rate, rather than the cost of capital (or weighted average cost of capital, WACC) which accounts for debt. In this calculation we've used 6.2%, which is based on a levered beta of 1.008. Beta is a measure of a stock's volatility, compared to the market as a whole. We get our beta from the industry average beta of globally comparable companies, with an imposed limit between 0.8 and 2.0, which is a reasonable range for a stable business.
SWOT Analysis for Fresenius Medical Care KGaA
- Debt is well covered by earnings and cashflows.
- Dividends are covered by earnings and cash flows.
- Earnings declined over the past year.
- Dividend is low compared to the top 25% of dividend payers in the Healthcare market.
- Annual earnings are forecast to grow faster than the German market.
- Good value based on P/E ratio and estimated fair value.
- Revenue is forecast to grow slower than 20% per year.
Moving On:
Whilst important, the DCF calculation ideally won't be the sole piece of analysis you scrutinize for a company. DCF models are not the be-all and end-all of investment valuation. Instead the best use for a DCF model is to test certain assumptions and theories to see if they would lead to the company being undervalued or overvalued. For example, changes in the company's cost of equity or the risk free rate can significantly impact the valuation. Why is the intrinsic value higher than the current share price? For Fresenius Medical Care KGaA, we've compiled three essential items you should explore:
- Risks: Case in point, we've spotted 2 warning signs for Fresenius Medical Care KGaA you should be aware of.
- Future Earnings: How does FME's growth rate compare to its peers and the wider market? Dig deeper into the analyst consensus number for the upcoming years by interacting with our free analyst growth expectation chart.
- Other Solid Businesses: Low debt, high returns on equity and good past performance are fundamental to a strong business. Why not explore our interactive list of stocks with solid business fundamentals to see if there are other companies you may not have considered!
PS. Simply Wall St updates its DCF calculation for every German stock every day, so if you want to find the intrinsic value of any other stock just search here.
If you're looking to trade Fresenius Medical Care, open an account with the lowest-cost platform trusted by professionals, Interactive Brokers.
With clients in over 200 countries and territories, and access to 160 markets, IBKR lets you trade stocks, options, futures, forex, bonds and funds from a single integrated account.
Enjoy no hidden fees, no account minimums, and FX conversion rates as low as 0.03%, far better than what most brokers offer.
Sponsored ContentNew: AI Stock Screener & Alerts
Our new AI Stock Screener scans the market every day to uncover opportunities.
• Dividend Powerhouses (3%+ Yield)
• Undervalued Small Caps with Insider Buying
• High growth Tech and AI Companies
Or build your own from over 50 metrics.
Have feedback on this article? Concerned about the content? Get in touch with us directly. Alternatively, email editorial-team (at) simplywallst.com.
This article by Simply Wall St is general in nature. We provide commentary based on historical data and analyst forecasts only using an unbiased methodology and our articles are not intended to be financial advice. It does not constitute a recommendation to buy or sell any stock, and does not take account of your objectives, or your financial situation. We aim to bring you long-term focused analysis driven by fundamental data. Note that our analysis may not factor in the latest price-sensitive company announcements or qualitative material. Simply Wall St has no position in any stocks mentioned.
About XTRA:FME
Fresenius Medical Care
Provides dialysis and related services for individuals with renal diseases in Germany, the United States, and internationally.
Excellent balance sheet established dividend payer.

