
If we want to find a potential multi-bagger, often there are underlying trends that can provide clues. Firstly, we'd want to identify a growing return on capital employed (ROCE) and then alongside that, an ever-increasing base of capital employed. If you see this, it typically means it's a company with a great business model and plenty of profitable reinvestment opportunities. Speaking of which, we noticed some great changes in CropEnergies' (ETR:CE2) returns on capital, so let's have a look.
What is Return On Capital Employed (ROCE)?
If you haven't worked with ROCE before, it measures the 'return' (pre-tax profit) a company generates from capital employed in its business. Analysts use this formula to calculate it for CropEnergies:
Return on Capital Employed = Earnings Before Interest and Tax (EBIT) ÷ (Total Assets - Current Liabilities)
0.20 = €112m ÷ (€691m - €121m) (Based on the trailing twelve months to August 2020).
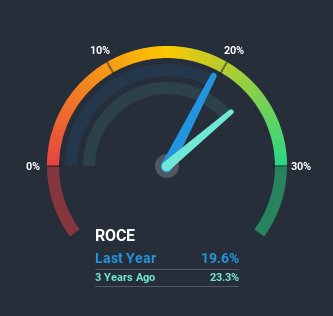
Thus, CropEnergies has an ROCE of 20%. In absolute terms, that's a satisfactory return, but compared to the Oil and Gas industry average of 6.7% it's much better.
View our latest analysis for CropEnergies
In the above chart we have measured CropEnergies' prior ROCE against its prior performance, but the future is arguably more important. If you'd like to see what analysts are forecasting going forward, you should check out our free report for CropEnergies.
What Can We Tell From CropEnergies' ROCE Trend?
We like the trends that we're seeing from CropEnergies. The numbers show that in the last five years, the returns generated on capital employed have grown considerably to 20%. Basically the business is earning more per dollar of capital invested and in addition to that, 22% more capital is being employed now too. The increasing returns on a growing amount of capital is common amongst multi-baggers and that's why we're impressed.
In Conclusion...
To sum it up, CropEnergies has proven it can reinvest in the business and generate higher returns on that capital employed, which is terrific. And a remarkable 147% total return over the last five years tells us that investors are expecting more good things to come in the future. With that being said, we still think the promising fundamentals mean the company deserves some further due diligence.
Since virtually every company faces some risks, it's worth knowing what they are, and we've spotted 3 warning signs for CropEnergies (of which 1 is potentially serious!) that you should know about.
If you want to search for solid companies with great earnings, check out this free list of companies with good balance sheets and impressive returns on equity.
If you’re looking to trade CropEnergies, open an account with the lowest-cost* platform trusted by professionals, Interactive Brokers. Their clients from over 200 countries and territories trade stocks, options, futures, forex, bonds and funds worldwide from a single integrated account. Promoted
If you're looking to trade CropEnergies, open an account with the lowest-cost platform trusted by professionals, Interactive Brokers.
With clients in over 200 countries and territories, and access to 160 markets, IBKR lets you trade stocks, options, futures, forex, bonds and funds from a single integrated account.
Enjoy no hidden fees, no account minimums, and FX conversion rates as low as 0.03%, far better than what most brokers offer.
Sponsored ContentNew: AI Stock Screener & Alerts
Our new AI Stock Screener scans the market every day to uncover opportunities.
• Dividend Powerhouses (3%+ Yield)
• Undervalued Small Caps with Insider Buying
• High growth Tech and AI Companies
Or build your own from over 50 metrics.
This article by Simply Wall St is general in nature. It does not constitute a recommendation to buy or sell any stock, and does not take account of your objectives, or your financial situation. We aim to bring you long-term focused analysis driven by fundamental data. Note that our analysis may not factor in the latest price-sensitive company announcements or qualitative material. Simply Wall St has no position in any stocks mentioned.
*Interactive Brokers Rated Lowest Cost Broker by StockBrokers.com Annual Online Review 2020
Have feedback on this article? Concerned about the content? Get in touch with us directly. Alternatively, email editorial-team@simplywallst.com.
About XTRA:CE2
CropEnergies
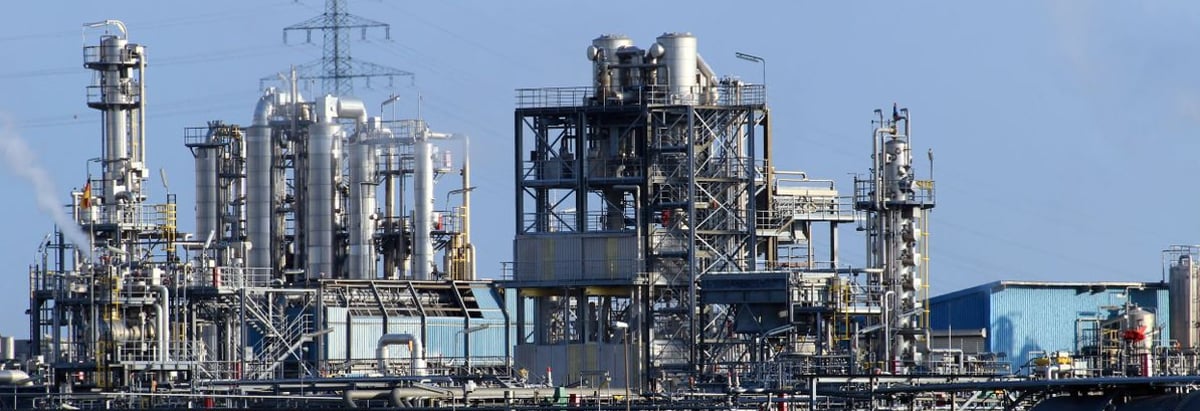
Manufactures and distributes bioethanol, and other biofuels and related products produced from grain or other agricultural raw materials in Germany and internationally.
Flawless balance sheet average dividend payer.
Market Insights

Community Narratives


