Some Investors May Be Worried About adidas' (ETR:ADS) Returns On Capital


When we're researching a company, it's sometimes hard to find the warning signs, but there are some financial metrics that can help spot trouble early. A business that's potentially in decline often shows two trends, a return on capital employed (ROCE) that's declining, and a base of capital employed that's also declining. This indicates to us that the business is not only shrinking the size of its net assets, but its returns are falling as well. So after glancing at the trends within adidas (ETR:ADS), we weren't too hopeful.
What Is Return On Capital Employed (ROCE)?
For those who don't know, ROCE is a measure of a company's yearly pre-tax profit (its return), relative to the capital employed in the business. The formula for this calculation on adidas is:
Return on Capital Employed = Earnings Before Interest and Tax (EBIT) ÷ (Total Assets - Current Liabilities)
0.023 = €241m ÷ (€19b - €8.2b) (Based on the trailing twelve months to December 2023).
So, adidas has an ROCE of 2.3%. Ultimately, that's a low return and it under-performs the Luxury industry average of 15%.
See our latest analysis for adidas
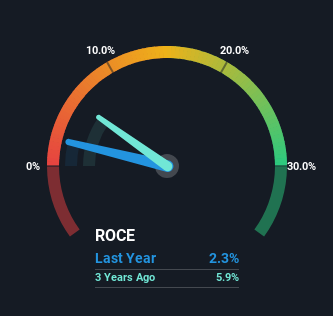
Above you can see how the current ROCE for adidas compares to its prior returns on capital, but there's only so much you can tell from the past. If you'd like to see what analysts are forecasting going forward, you should check out our free analyst report for adidas .
What Can We Tell From adidas' ROCE Trend?
There is reason to be cautious about adidas, given the returns are trending downwards. About five years ago, returns on capital were 27%, however they're now substantially lower than that as we saw above. Meanwhile, capital employed in the business has stayed roughly the flat over the period. This combination can be indicative of a mature business that still has areas to deploy capital, but the returns received aren't as high due potentially to new competition or smaller margins. If these trends continue, we wouldn't expect adidas to turn into a multi-bagger.
On a separate but related note, it's important to know that adidas has a current liabilities to total assets ratio of 44%, which we'd consider pretty high. This can bring about some risks because the company is basically operating with a rather large reliance on its suppliers or other sorts of short-term creditors. Ideally we'd like to see this reduce as that would mean fewer obligations bearing risks.
The Bottom Line
In the end, the trend of lower returns on the same amount of capital isn't typically an indication that we're looking at a growth stock. And, the stock has remained flat over the last five years, so investors don't seem too impressed either. That being the case, unless the underlying trends revert to a more positive trajectory, we'd consider looking elsewhere.
One final note, you should learn about the 2 warning signs we've spotted with adidas (including 1 which doesn't sit too well with us) .
While adidas isn't earning the highest return, check out this free list of companies that are earning high returns on equity with solid balance sheets.
If you're looking to trade adidas, open an account with the lowest-cost platform trusted by professionals, Interactive Brokers.
With clients in over 200 countries and territories, and access to 160 markets, IBKR lets you trade stocks, options, futures, forex, bonds and funds from a single integrated account.
Enjoy no hidden fees, no account minimums, and FX conversion rates as low as 0.03%, far better than what most brokers offer.
Sponsored ContentNew: AI Stock Screener & Alerts
Our new AI Stock Screener scans the market every day to uncover opportunities.
• Dividend Powerhouses (3%+ Yield)
• Undervalued Small Caps with Insider Buying
• High growth Tech and AI Companies
Or build your own from over 50 metrics.
Have feedback on this article? Concerned about the content? Get in touch with us directly. Alternatively, email editorial-team (at) simplywallst.com.
This article by Simply Wall St is general in nature. We provide commentary based on historical data and analyst forecasts only using an unbiased methodology and our articles are not intended to be financial advice. It does not constitute a recommendation to buy or sell any stock, and does not take account of your objectives, or your financial situation. We aim to bring you long-term focused analysis driven by fundamental data. Note that our analysis may not factor in the latest price-sensitive company announcements or qualitative material. Simply Wall St has no position in any stocks mentioned.
About XTRA:ADS
adidas
Designs, develops, produces, and markets athletic and sports lifestyle products in Europe, the Middle East, Africa, North America, Greater China, the Asia-Pacific, and Latin America.
High growth potential with excellent balance sheet.

