
Advertisement

David Iben put it well when he said, 'Volatility is not a risk we care about. What we care about is avoiding the permanent loss of capital.' It's only natural to consider a company's balance sheet when you examine how risky it is, since debt is often involved when a business collapses. We note that adidas AG (ETR:ADS) does have debt on its balance sheet. But is this debt a concern to shareholders?
What Risk Does Debt Bring?
Debt is a tool to help businesses grow, but if a business is incapable of paying off its lenders, then it exists at their mercy. If things get really bad, the lenders can take control of the business. However, a more usual (but still expensive) situation is where a company must dilute shareholders at a cheap share price simply to get debt under control. Having said that, the most common situation is where a company manages its debt reasonably well - and to its own advantage. The first step when considering a company's debt levels is to consider its cash and debt together.
See our latest analysis for adidas
What Is adidas's Net Debt?
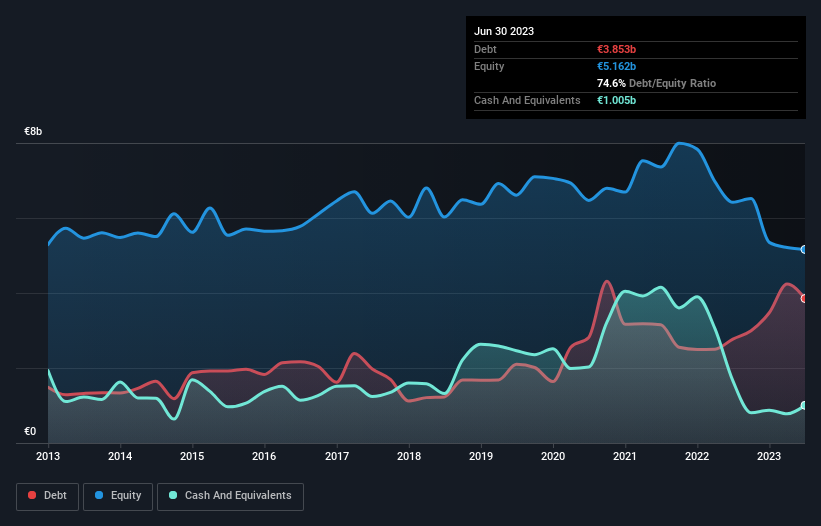
You can click the graphic below for the historical numbers, but it shows that as of June 2023 adidas had €3.85b of debt, an increase on €2.77b, over one year. However, it does have €1.01b in cash offsetting this, leading to net debt of about €2.85b.
How Strong Is adidas' Balance Sheet?
We can see from the most recent balance sheet that adidas had liabilities of €8.73b falling due within a year, and liabilities of €5.45b due beyond that. Offsetting these obligations, it had cash of €1.01b as well as receivables valued at €2.69b due within 12 months. So it has liabilities totalling €10.5b more than its cash and near-term receivables, combined.
While this might seem like a lot, it is not so bad since adidas has a huge market capitalization of €30.4b, and so it could probably strengthen its balance sheet by raising capital if it needed to. However, it is still worthwhile taking a close look at its ability to pay off debt.
In order to size up a company's debt relative to its earnings, we calculate its net debt divided by its earnings before interest, tax, depreciation, and amortization (EBITDA) and its earnings before interest and tax (EBIT) divided by its interest expense (its interest cover). The advantage of this approach is that we take into account both the absolute quantum of debt (with net debt to EBITDA) and the actual interest expenses associated with that debt (with its interest cover ratio).
adidas's debt is 4.3 times its EBITDA, and its EBIT cover its interest expense 2.7 times over. Taken together this implies that, while we wouldn't want to see debt levels rise, we think it can handle its current leverage. Worse, adidas's EBIT was down 87% over the last year. If earnings continue to follow that trajectory, paying off that debt load will be harder than convincing us to run a marathon in the rain. The balance sheet is clearly the area to focus on when you are analysing debt. But it is future earnings, more than anything, that will determine adidas's ability to maintain a healthy balance sheet going forward. So if you're focused on the future you can check out this free report showing analyst profit forecasts.
Finally, a business needs free cash flow to pay off debt; accounting profits just don't cut it. So the logical step is to look at the proportion of that EBIT that is matched by actual free cash flow. During the last three years, adidas generated free cash flow amounting to a very robust 92% of its EBIT, more than we'd expect. That puts it in a very strong position to pay down debt.
Our View
Neither adidas's ability to grow its EBIT nor its interest cover gave us confidence in its ability to take on more debt. But its conversion of EBIT to free cash flow tells a very different story, and suggests some resilience. When we consider all the factors discussed, it seems to us that adidas is taking some risks with its use of debt. So while that leverage does boost returns on equity, we wouldn't really want to see it increase from here. When analysing debt levels, the balance sheet is the obvious place to start. However, not all investment risk resides within the balance sheet - far from it. Be aware that adidas is showing 1 warning sign in our investment analysis , you should know about...
If, after all that, you're more interested in a fast growing company with a rock-solid balance sheet, then check out our list of net cash growth stocks without delay.
New: AI Stock Screener & Alerts
Our new AI Stock Screener scans the market every day to uncover opportunities.
• Dividend Powerhouses (3%+ Yield)
• Undervalued Small Caps with Insider Buying
• High growth Tech and AI Companies
Or build your own from over 50 metrics.
Have feedback on this article? Concerned about the content? Get in touch with us directly. Alternatively, email editorial-team (at) simplywallst.com.
This article by Simply Wall St is general in nature. We provide commentary based on historical data and analyst forecasts only using an unbiased methodology and our articles are not intended to be financial advice. It does not constitute a recommendation to buy or sell any stock, and does not take account of your objectives, or your financial situation. We aim to bring you long-term focused analysis driven by fundamental data. Note that our analysis may not factor in the latest price-sensitive company announcements or qualitative material. Simply Wall St has no position in any stocks mentioned.
About XTRA:ADS
adidas
Designs, develops, produces, and markets athletic and sports lifestyle products in Europe, the Middle East, Africa, North America, Greater China, the Asia-Pacific, and Latin America.
High growth potential with excellent balance sheet.
Similar Companies
Market Insights


Advertisement
Community Narratives
Nike's Direct-to-Consumer Focus Will Drive Future Growth
Fair Value US$87.90|18.2% undervalued
UN
Community Contributor
Novo Nordisk will dominate GLP-1 market with Ozempic and Wegovy growth
Fair Value US$89.59|12.1% undervalued
BE
Community Contributor
Rheinmetall could get 20-25% of EU-NATO 3%-GDP defence spending
Fair Value €7.57k|82.4% undervalued
NO
Community Contributor