

Legendary fund manager Li Lu (who Charlie Munger backed) once said, 'The biggest investment risk is not the volatility of prices, but whether you will suffer a permanent loss of capital.' It's only natural to consider a company's balance sheet when you examine how risky it is, since debt is often involved when a business collapses. As with many other companies adidas AG (ETR:ADS) makes use of debt. But is this debt a concern to shareholders?
Why Does Debt Bring Risk?
Debt is a tool to help businesses grow, but if a business is incapable of paying off its lenders, then it exists at their mercy. If things get really bad, the lenders can take control of the business. However, a more common (but still painful) scenario is that it has to raise new equity capital at a low price, thus permanently diluting shareholders. Of course, the upside of debt is that it often represents cheap capital, especially when it replaces dilution in a company with the ability to reinvest at high rates of return. The first thing to do when considering how much debt a business uses is to look at its cash and debt together.
Check out our latest analysis for adidas
What Is adidas's Debt?
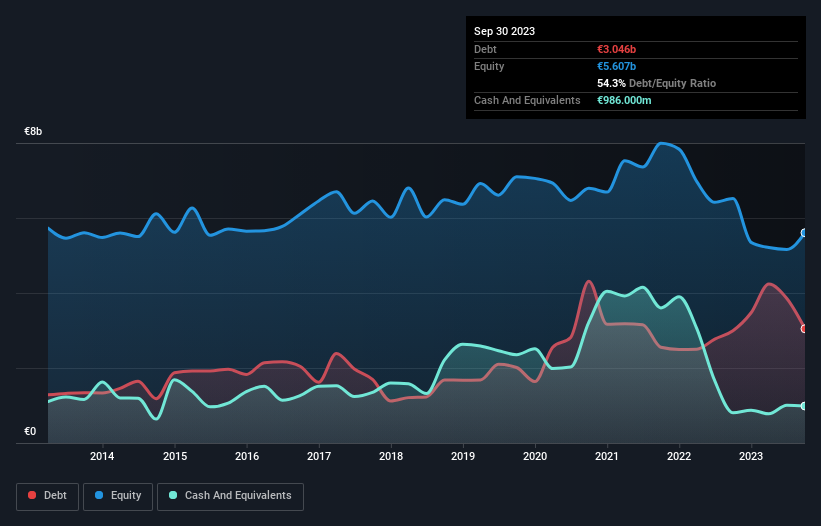
As you can see below, adidas had €3.05b of debt, at September 2023, which is about the same as the year before. You can click the chart for greater detail. However, because it has a cash reserve of €986.0m, its net debt is less, at about €2.06b.
How Healthy Is adidas' Balance Sheet?
The latest balance sheet data shows that adidas had liabilities of €8.18b due within a year, and liabilities of €4.94b falling due after that. Offsetting this, it had €986.0m in cash and €2.84b in receivables that were due within 12 months. So it has liabilities totalling €9.29b more than its cash and near-term receivables, combined.
This deficit isn't so bad because adidas is worth a massive €33.7b, and thus could probably raise enough capital to shore up its balance sheet, if the need arose. But it's clear that we should definitely closely examine whether it can manage its debt without dilution. When analysing debt levels, the balance sheet is the obvious place to start. But it is future earnings, more than anything, that will determine adidas's ability to maintain a healthy balance sheet going forward. So if you're focused on the future you can check out this free report showing analyst profit forecasts.
Over 12 months, adidas made a loss at the EBIT level, and saw its revenue drop to €22b, which is a fall of 2.8%. We would much prefer see growth.
Caveat Emptor
Importantly, adidas had an earnings before interest and tax (EBIT) loss over the last year. To be specific the EBIT loss came in at €15m. Considering that alongside the liabilities mentioned above does not give us much confidence that company should be using so much debt. So we think its balance sheet is a little strained, though not beyond repair. For example, we would not want to see a repeat of last year's loss of €179m. So we do think this stock is quite risky. When we look at a riskier company, we like to check how their profits (or losses) are trending over time. Today, we're providing readers this interactive graph showing how adidas's profit, revenue, and operating cashflow have changed over the last few years.
If, after all that, you're more interested in a fast growing company with a rock-solid balance sheet, then check out our list of net cash growth stocks without delay.
New: AI Stock Screener & Alerts
Our new AI Stock Screener scans the market every day to uncover opportunities.
• Dividend Powerhouses (3%+ Yield)
• Undervalued Small Caps with Insider Buying
• High growth Tech and AI Companies
Or build your own from over 50 metrics.
Have feedback on this article? Concerned about the content? Get in touch with us directly. Alternatively, email editorial-team (at) simplywallst.com.
This article by Simply Wall St is general in nature. We provide commentary based on historical data and analyst forecasts only using an unbiased methodology and our articles are not intended to be financial advice. It does not constitute a recommendation to buy or sell any stock, and does not take account of your objectives, or your financial situation. We aim to bring you long-term focused analysis driven by fundamental data. Note that our analysis may not factor in the latest price-sensitive company announcements or qualitative material. Simply Wall St has no position in any stocks mentioned.
About XTRA:ADS
adidas
Designs, develops, produces, and markets athletic and sports lifestyle products in Europe, the Middle East, Africa, North America, Greater China, the Asia-Pacific, and Latin America.
High growth potential with excellent balance sheet.
