
Advertisement
Howard Marks put it nicely when he said that, rather than worrying about share price volatility, 'The possibility of permanent loss is the risk I worry about... and every practical investor I know worries about.' When we think about how risky a company is, we always like to look at its use of debt, since debt overload can lead to ruin. We note that InnoTec TSS AG (FRA:TSS) does have debt on its balance sheet. But the more important question is: how much risk is that debt creating?
When Is Debt Dangerous?
Debt assists a business until the business has trouble paying it off, either with new capital or with free cash flow. Ultimately, if the company can't fulfill its legal obligations to repay debt, shareholders could walk away with nothing. However, a more frequent (but still costly) occurrence is where a company must issue shares at bargain-basement prices, permanently diluting shareholders, just to shore up its balance sheet. By replacing dilution, though, debt can be an extremely good tool for businesses that need capital to invest in growth at high rates of return. When we examine debt levels, we first consider both cash and debt levels, together.
View our latest analysis for InnoTec TSS
What Is InnoTec TSS's Debt?
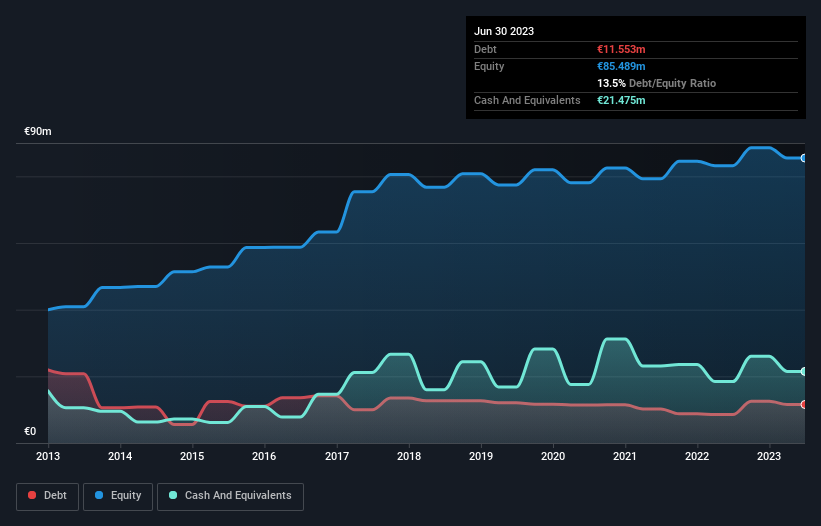
As you can see below, at the end of June 2023, InnoTec TSS had €11.6m of debt, up from €8.52m a year ago. Click the image for more detail. However, it does have €21.5m in cash offsetting this, leading to net cash of €9.92m.
A Look At InnoTec TSS' Liabilities
According to the last reported balance sheet, InnoTec TSS had liabilities of €14.7m due within 12 months, and liabilities of €13.3m due beyond 12 months. Offsetting this, it had €21.5m in cash and €11.5m in receivables that were due within 12 months. So it can boast €5.05m more liquid assets than total liabilities.
This surplus suggests that InnoTec TSS has a conservative balance sheet, and could probably eliminate its debt without much difficulty. Succinctly put, InnoTec TSS boasts net cash, so it's fair to say it does not have a heavy debt load!
On the other hand, InnoTec TSS's EBIT dived 17%, over the last year. If that rate of decline in earnings continues, the company could find itself in a tight spot. When analysing debt levels, the balance sheet is the obvious place to start. But it is InnoTec TSS's earnings that will influence how the balance sheet holds up in the future. So if you're keen to discover more about its earnings, it might be worth checking out this graph of its long term earnings trend.
Finally, while the tax-man may adore accounting profits, lenders only accept cold hard cash. InnoTec TSS may have net cash on the balance sheet, but it is still interesting to look at how well the business converts its earnings before interest and tax (EBIT) to free cash flow, because that will influence both its need for, and its capacity to manage debt. Over the most recent three years, InnoTec TSS recorded free cash flow worth 52% of its EBIT, which is around normal, given free cash flow excludes interest and tax. This cold hard cash means it can reduce its debt when it wants to.
Summing Up
While it is always sensible to investigate a company's debt, in this case InnoTec TSS has €9.92m in net cash and a decent-looking balance sheet. So we are not troubled with InnoTec TSS's debt use. When analysing debt levels, the balance sheet is the obvious place to start. However, not all investment risk resides within the balance sheet - far from it. These risks can be hard to spot. Every company has them, and we've spotted 1 warning sign for InnoTec TSS you should know about.
If, after all that, you're more interested in a fast growing company with a rock-solid balance sheet, then check out our list of net cash growth stocks without delay.
New: AI Stock Screener & Alerts
Our new AI Stock Screener scans the market every day to uncover opportunities.
• Dividend Powerhouses (3%+ Yield)
• Undervalued Small Caps with Insider Buying
• High growth Tech and AI Companies
Or build your own from over 50 metrics.
Have feedback on this article? Concerned about the content? Get in touch with us directly. Alternatively, email editorial-team (at) simplywallst.com.
This article by Simply Wall St is general in nature. We provide commentary based on historical data and analyst forecasts only using an unbiased methodology and our articles are not intended to be financial advice. It does not constitute a recommendation to buy or sell any stock, and does not take account of your objectives, or your financial situation. We aim to bring you long-term focused analysis driven by fundamental data. Note that our analysis may not factor in the latest price-sensitive company announcements or qualitative material. Simply Wall St has no position in any stocks mentioned.
About DB:TSS
InnoTec TSS
Through its subsidiaries, produces and sells exterior door panels for the construction industry in Germany, Europe, and internationally.
Flawless balance sheet, good value and pays a dividend.
Market Insights

Advertisement
Weekly Picks
RO


RockeTeller on Santacruz Silver Mining ·
Crazy Undervalued 42 Baggers Silver Play (Active & Running Mine)
Fair Value:CA$8696.7% undervalued
15 followersusers have followed this narrative
5 commentsusers have commented on this narrative
2 likesusers have liked this narrative
RO


Robbo on Fiducian Group ·
Fiducian: Compliance Clouds or Value Opportunity?
Fair Value:AU$126.1% undervalued
3 followersusers have followed this narrative
0 commentsusers have commented on this narrative
0 likesusers have liked this narrative
WO

woodworthfund on Willamette Valley Vineyards ·
Willamette Valley Vineyards (WVVI): Not-So-Great Value
Fair Value:US$242.5% overvalued
2 followersusers have followed this narrative
0 commentsusers have commented on this narrative
1 likeusers have liked this narrative
Recently Updated Narratives
MA


MarkoVT on Applied Digital ·
Staggered by dilution; positions for growth
Fair Value:US$35.4520.9% undervalued
4 followersusers have followed this narrative
0 commentsusers have commented on this narrative
0 likesusers have liked this narrative
YE
Yellow_fever on China Starch Holdings ·
China Starch Holdings eyes a revenue growth of 4.66% with a 5-year strategic plan
Fair Value:HK$0.563.2% undervalued
1 followerusers have followed this narrative
0 commentsusers have commented on this narrative
0 likesusers have liked this narrative
CO

composite32 on Power Solutions International ·
PSIX The timing of insider sales is a serious question mark
Fair Value:US$37.3845.7% overvalued
1 followerusers have followed this narrative
0 commentsusers have commented on this narrative
0 likesusers have liked this narrative
Popular Narratives
TH


TheWallstreetKing on MicroVision ·
MicroVision will explode future revenue by 380.37% with a vision towards success
Fair Value:US$6098.6% undervalued
112 followersusers have followed this narrative
11 commentsusers have commented on this narrative
22 likesusers have liked this narrative
AN


AnalystConsensusTarget on NVIDIA ·
NVDA: Expanding AI Demand Will Drive Major Data Center Investments Through 2026
Fair Value:US$250.3927.5% undervalued
948 followersusers have followed this narrative
6 commentsusers have commented on this narrative
24 likesusers have liked this narrative
OS


oscargarcia on Alphabet ·
The company that turned a verb into a global necessity and basically runs the modern internet, digital ads, smartphones, maps, and AI.
Fair Value:US$3407.1% undervalued
148 followersusers have followed this narrative
6 commentsusers have commented on this narrative
18 likesusers have liked this narrative

