
Advertisement
Should STS Group (ETR:SF3) Be Disappointed With Their 86% Profit?

Passive investing in index funds can generate returns that roughly match the overall market. But investors can boost returns by picking market-beating companies to own shares in. To wit, the STS Group AG (ETR:SF3) share price is 86% higher than it was a year ago, much better than the market return of around 15% (not including dividends) in the same period. That's a solid performance by our standards! We'll need to follow STS Group for a while to get a better sense of its share price trend, since it hasn't been listed for particularly long.
See our latest analysis for STS Group
STS Group isn't currently profitable, so most analysts would look to revenue growth to get an idea of how fast the underlying business is growing. When a company doesn't make profits, we'd generally expect to see good revenue growth. As you can imagine, fast revenue growth, when maintained, often leads to fast profit growth.
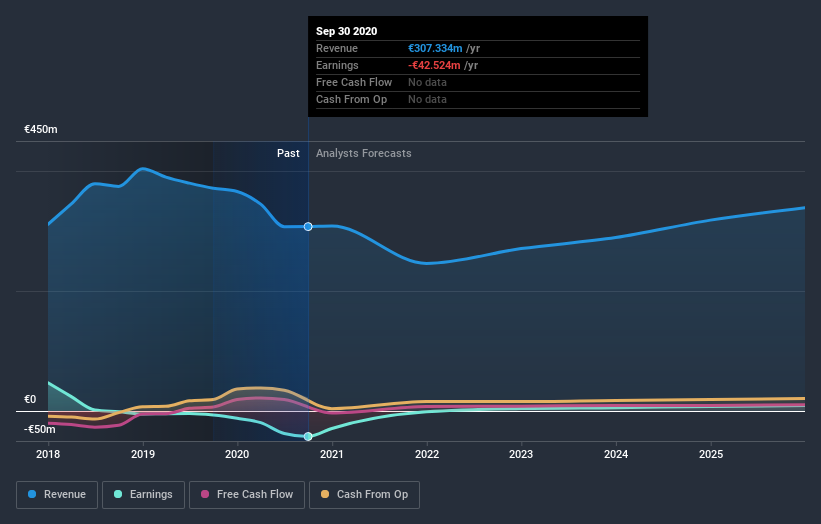
In the last year STS Group saw its revenue shrink by 17%. Despite the lack of revenue growth, the stock has returned a solid 86% the last twelve months. To us that means that there isn't a lot of correlation between the past revenue performance and the share price, but a closer look at analyst forecasts and the bottom line may well explain a lot.
The graphic below depicts how earnings and revenue have changed over time (unveil the exact values by clicking on the image).
Balance sheet strength is crucial. It might be well worthwhile taking a look at our free report on how its financial position has changed over time.
A Different Perspective
STS Group shareholders should be happy with the total gain of 86% over the last twelve months. A substantial portion of that gain has come in the last three months, with the stock up 62% in that time. This suggests the company is continuing to win over new investors. It's always interesting to track share price performance over the longer term. But to understand STS Group better, we need to consider many other factors. For example, we've discovered 3 warning signs for STS Group that you should be aware of before investing here.
If you like to buy stocks alongside management, then you might just love this free list of companies. (Hint: insiders have been buying them).
Please note, the market returns quoted in this article reflect the market weighted average returns of stocks that currently trade on DE exchanges.
If you’re looking to trade STS Group, open an account with the lowest-cost* platform trusted by professionals, Interactive Brokers. Their clients from over 200 countries and territories trade stocks, options, futures, forex, bonds and funds worldwide from a single integrated account. Promoted
New: Manage All Your Stock Portfolios in One Place
We've created the ultimate portfolio companion for stock investors, and it's free.
• Connect an unlimited number of Portfolios and see your total in one currency
• Be alerted to new Warning Signs or Risks via email or mobile
• Track the Fair Value of your stocks
This article by Simply Wall St is general in nature. It does not constitute a recommendation to buy or sell any stock, and does not take account of your objectives, or your financial situation. We aim to bring you long-term focused analysis driven by fundamental data. Note that our analysis may not factor in the latest price-sensitive company announcements or qualitative material. Simply Wall St has no position in any stocks mentioned.
*Interactive Brokers Rated Lowest Cost Broker by StockBrokers.com Annual Online Review 2020
Have feedback on this article? Concerned about the content? Get in touch with us directly. Alternatively, email editorial-team (at) simplywallst.com.
About XTRA:SF3
STS Group
Supplies components and systems for the commercial vehicle and automotive industry in Germany, France, Mexico, the United States, and China.
Undervalued with excellent balance sheet.
Similar Companies
Market Insights


Advertisement
Community Narratives
Nike's Direct-to-Consumer Focus Will Drive Future Growth
Fair Value US$87.90|18.2% undervalued
UN
Community Contributor
Novo Nordisk will dominate GLP-1 market with Ozempic and Wegovy growth
Fair Value US$89.59|12.1% undervalued
BE
Community Contributor
Rheinmetall could get 20-25% of EU-NATO 3%-GDP defence spending
Fair Value €7.57k|82.4% undervalued
NO
Community Contributor