- China
- /
- Electronic Equipment and Components
- /
- SZSE:300686
Shenzhen CDL Precision Technology Co., Ltd's (SZSE:300686) Shares Bounce 41% But Its Business Still Trails The Industry

Shenzhen CDL Precision Technology Co., Ltd (SZSE:300686) shareholders would be excited to see that the share price has had a great month, posting a 41% gain and recovering from prior weakness. Not all shareholders will be feeling jubilant, since the share price is still down a very disappointing 11% in the last twelve months.
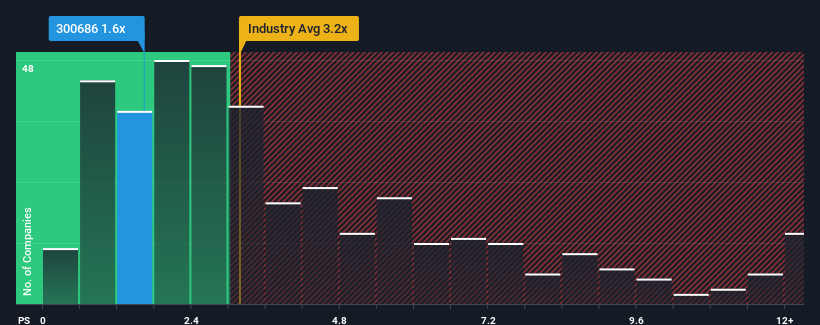
In spite of the firm bounce in price, Shenzhen CDL Precision Technology may still be sending bullish signals at the moment with its price-to-sales (or "P/S") ratio of 1.6x, since almost half of all companies in the Electronic industry in China have P/S ratios greater than 3.2x and even P/S higher than 6x are not unusual. However, the P/S might be low for a reason and it requires further investigation to determine if it's justified.
View our latest analysis for Shenzhen CDL Precision Technology
What Does Shenzhen CDL Precision Technology's Recent Performance Look Like?
We'd have to say that with no tangible growth over the last year, Shenzhen CDL Precision Technology's revenue has been unimpressive. Perhaps the market believes the recent lacklustre revenue performance is a sign of future underperformance relative to industry peers, hurting the P/S. Those who are bullish on Shenzhen CDL Precision Technology will be hoping that this isn't the case, so that they can pick up the stock at a lower valuation.
Want the full picture on earnings, revenue and cash flow for the company? Then our free report on Shenzhen CDL Precision Technology will help you shine a light on its historical performance.Is There Any Revenue Growth Forecasted For Shenzhen CDL Precision Technology?
The only time you'd be truly comfortable seeing a P/S as low as Shenzhen CDL Precision Technology's is when the company's growth is on track to lag the industry.
Retrospectively, the last year delivered virtually the same number to the company's top line as the year before. This isn't what shareholders were looking for as it means they've been left with a 43% decline in revenue over the last three years in total. Therefore, it's fair to say the revenue growth recently has been undesirable for the company.
Weighing that medium-term revenue trajectory against the broader industry's one-year forecast for expansion of 26% shows it's an unpleasant look.
In light of this, it's understandable that Shenzhen CDL Precision Technology's P/S would sit below the majority of other companies. Nonetheless, there's no guarantee the P/S has reached a floor yet with revenue going in reverse. There's potential for the P/S to fall to even lower levels if the company doesn't improve its top-line growth.
The Final Word
Shenzhen CDL Precision Technology's stock price has surged recently, but its but its P/S still remains modest. Typically, we'd caution against reading too much into price-to-sales ratios when settling on investment decisions, though it can reveal plenty about what other market participants think about the company.
It's no surprise that Shenzhen CDL Precision Technology maintains its low P/S off the back of its sliding revenue over the medium-term. At this stage investors feel the potential for an improvement in revenue isn't great enough to justify a higher P/S ratio. Given the current circumstances, it seems unlikely that the share price will experience any significant movement in either direction in the near future if recent medium-term revenue trends persist.
There are also other vital risk factors to consider before investing and we've discovered 2 warning signs for Shenzhen CDL Precision Technology that you should be aware of.
If companies with solid past earnings growth is up your alley, you may wish to see this free collection of other companies with strong earnings growth and low P/E ratios.
The New Payments ETF Is Live on NASDAQ:
Money is moving to real-time rails, and a newly listed ETF now gives investors direct exposure. Fast settlement. Institutional custody. Simple access.
Explore how this launch could reshape portfolios
Sponsored ContentNew: Manage All Your Stock Portfolios in One Place
We've created the ultimate portfolio companion for stock investors, and it's free.
• Connect an unlimited number of Portfolios and see your total in one currency
• Be alerted to new Warning Signs or Risks via email or mobile
• Track the Fair Value of your stocks
Have feedback on this article? Concerned about the content? Get in touch with us directly. Alternatively, email editorial-team (at) simplywallst.com.
This article by Simply Wall St is general in nature. We provide commentary based on historical data and analyst forecasts only using an unbiased methodology and our articles are not intended to be financial advice. It does not constitute a recommendation to buy or sell any stock, and does not take account of your objectives, or your financial situation. We aim to bring you long-term focused analysis driven by fundamental data. Note that our analysis may not factor in the latest price-sensitive company announcements or qualitative material. Simply Wall St has no position in any stocks mentioned.
About SZSE:300686
Shenzhen CDL Precision Technology
Produces and sells functional basic components, structural devices, and optical components for consumer electronics in China.
Flawless balance sheet and fair value.
Market Insights

Weekly Picks

THE KINGDOM OF BROWN GOODS: WHY MGPI IS BEING CRUSHED BY INVENTORY & PRIMED FOR RESURRECTION


Why Vertical Aerospace (NYSE: EVTL) is Worth Possibly Over 13x its Current Price


The Quiet Giant That Became AI’s Power Grid
Recently Updated Narratives


A tech powerhouse quietly powering the world’s AI infrastructure.


Keppel DC REIT (SGX: AJBU) is a resilient gem in the data center space.
Why Vertical Aerospace (NYSE: EVTL) is Worth Possibly Over 13x its Current Price
Popular Narratives

MicroVision will explode future revenue by 380.37% with a vision towards success


Crazy Undervalued 42 Baggers Silver Play (Active & Running Mine)


