
Advertisement
- China
- /
- Electronic Equipment and Components
- /
- SZSE:300546
Some Shenzhen Emperor Technology Co., Ltd. (SZSE:300546) Shareholders Look For Exit As Shares Take 30% Pounding
The Shenzhen Emperor Technology Co., Ltd. (SZSE:300546) share price has fared very poorly over the last month, falling by a substantial 30%. The recent drop completes a disastrous twelve months for shareholders, who are sitting on a 52% loss during that time.
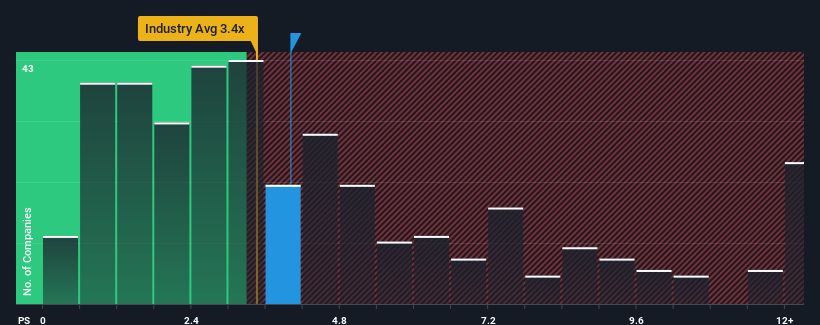
Even after such a large drop in price, it's still not a stretch to say that Shenzhen Emperor Technology's price-to-sales (or "P/S") ratio of 4x right now seems quite "middle-of-the-road" compared to the Electronic industry in China, where the median P/S ratio is around 3.4x. Although, it's not wise to simply ignore the P/S without explanation as investors may be disregarding a distinct opportunity or a costly mistake.
Check out our latest analysis for Shenzhen Emperor Technology
What Does Shenzhen Emperor Technology's P/S Mean For Shareholders?
As an illustration, revenue has deteriorated at Shenzhen Emperor Technology over the last year, which is not ideal at all. It might be that many expect the company to put the disappointing revenue performance behind them over the coming period, which has kept the P/S from falling. If not, then existing shareholders may be a little nervous about the viability of the share price.
Want the full picture on earnings, revenue and cash flow for the company? Then our free report on Shenzhen Emperor Technology will help you shine a light on its historical performance.Do Revenue Forecasts Match The P/S Ratio?
In order to justify its P/S ratio, Shenzhen Emperor Technology would need to produce growth that's similar to the industry.
Retrospectively, the last year delivered a frustrating 33% decrease to the company's top line. At least revenue has managed not to go completely backwards from three years ago in aggregate, thanks to the earlier period of growth. Therefore, it's fair to say that revenue growth has been inconsistent recently for the company.
Comparing the recent medium-term revenue trends against the industry's one-year growth forecast of 23% shows it's noticeably less attractive.
With this in mind, we find it intriguing that Shenzhen Emperor Technology's P/S is comparable to that of its industry peers. Apparently many investors in the company are less bearish than recent times would indicate and aren't willing to let go of their stock right now. They may be setting themselves up for future disappointment if the P/S falls to levels more in line with recent growth rates.
What We Can Learn From Shenzhen Emperor Technology's P/S?
With its share price dropping off a cliff, the P/S for Shenzhen Emperor Technology looks to be in line with the rest of the Electronic industry. Generally, our preference is to limit the use of the price-to-sales ratio to establishing what the market thinks about the overall health of a company.
Our examination of Shenzhen Emperor Technology revealed its poor three-year revenue trends aren't resulting in a lower P/S as per our expectations, given they look worse than current industry outlook. When we see weak revenue with slower than industry growth, we suspect the share price is at risk of declining, bringing the P/S back in line with expectations. If recent medium-term revenue trends continue, the probability of a share price decline will become quite substantial, placing shareholders at risk.
Don't forget that there may be other risks. For instance, we've identified 2 warning signs for Shenzhen Emperor Technology (1 is concerning) you should be aware of.
If these risks are making you reconsider your opinion on Shenzhen Emperor Technology, explore our interactive list of high quality stocks to get an idea of what else is out there.
New: Manage All Your Stock Portfolios in One Place
We've created the ultimate portfolio companion for stock investors, and it's free.
• Connect an unlimited number of Portfolios and see your total in one currency
• Be alerted to new Warning Signs or Risks via email or mobile
• Track the Fair Value of your stocks
Have feedback on this article? Concerned about the content? Get in touch with us directly. Alternatively, email editorial-team (at) simplywallst.com.
This article by Simply Wall St is general in nature. We provide commentary based on historical data and analyst forecasts only using an unbiased methodology and our articles are not intended to be financial advice. It does not constitute a recommendation to buy or sell any stock, and does not take account of your objectives, or your financial situation. We aim to bring you long-term focused analysis driven by fundamental data. Note that our analysis may not factor in the latest price-sensitive company announcements or qualitative material. Simply Wall St has no position in any stocks mentioned.
About SZSE:300546
Shenzhen Emperor Technology
Operates as an identity products and solutions provider in China and internationally.
Excellent balance sheet with acceptable track record.
Market Insights

Advertisement
Community Narratives
MicroVision will explode future revenue by 380.37% with a vision towards success
Fair Value US$60|98.4% undervalued
TH
Community Contributor
The Indispensable Artery for a New North American Economy
Fair Value CA$132.87|0.7% overvalued
TI
Community Contributor
Recently Updated Narratives
CO

composite32 on Astor Enerji ·
Astor Enerji will surge with a fair value of $140.43 in the next 3 years
Fair Value:₺140.4335.5% undervalued
1 followerusers have followed this narrative
0 commentsusers have commented on this narrative
0 likesusers have liked this narrative
RE

RecMag on Proximus ·
Proximus: The State-Backed Backup Plan with 7% Gross Yield and 15% Currency Upside.
Fair Value:€17.1356.7% undervalued
29 followersusers have followed this narrative
0 commentsusers have commented on this narrative
0 likesusers have liked this narrative
AG


Agricola on IMPACT Silver ·
A case for for IMPACT Silver Corp (TSXV:IPT) to reach USD $4.52 (CAD $6.16) in 2026 (23 bagger in 1 year) and USD $5.76 (CAD $7.89) by 2030
Fair Value:CA$7.8996.2% undervalued
1 followerusers have followed this narrative
0 commentsusers have commented on this narrative
0 likesusers have liked this narrative
Popular Narratives
TH

TheWallstreetKing on MicroVision ·
MicroVision will explode future revenue by 380.37% with a vision towards success
Fair Value:US$6098.4% undervalued
101 followersusers have followed this narrative
10 commentsusers have commented on this narrative
20 likesusers have liked this narrative
OS


oscargarcia on Alphabet ·
The company that turned a verb into a global necessity and basically runs the modern internet, digital ads, smartphones, maps, and AI.
Fair Value:US$3405.8% undervalued
137 followersusers have followed this narrative
6 commentsusers have commented on this narrative
18 likesusers have liked this narrative
AN


AnalystConsensusTarget on NVIDIA ·
NVDA: Expanding AI Demand Will Drive Major Data Center Investments Through 2026
Fair Value:US$250.3929.3% undervalued
929 followersusers have followed this narrative
6 commentsusers have commented on this narrative
22 likesusers have liked this narrative