- China
- /
- Communications
- /
- SZSE:300308
Additional Considerations Required While Assessing Zhongji Innolight's (SZSE:300308) Strong Earnings


Zhongji Innolight Co., Ltd. (SZSE:300308) announced strong profits, but the stock was stagnant. Our analysis suggests that shareholders have noticed something concerning in the numbers.
View our latest analysis for Zhongji Innolight
Examining Cashflow Against Zhongji Innolight's Earnings
In high finance, the key ratio used to measure how well a company converts reported profits into free cash flow (FCF) is the accrual ratio (from cashflow). In plain english, this ratio subtracts FCF from net profit, and divides that number by the company's average operating assets over that period. The ratio shows us how much a company's profit exceeds its FCF.
Therefore, it's actually considered a good thing when a company has a negative accrual ratio, but a bad thing if its accrual ratio is positive. That is not intended to imply we should worry about a positive accrual ratio, but it's worth noting where the accrual ratio is rather high. That's because some academic studies have suggested that high accruals ratios tend to lead to lower profit or less profit growth.
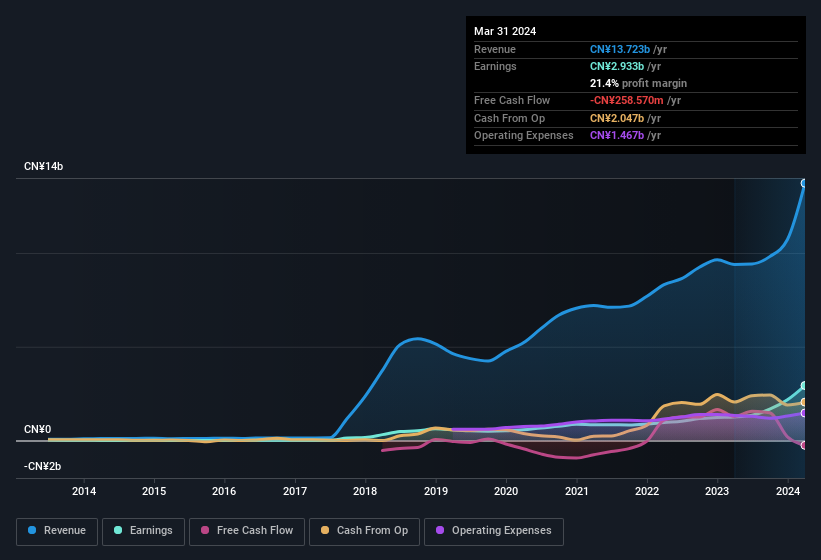
Over the twelve months to March 2024, Zhongji Innolight recorded an accrual ratio of 0.27. We can therefore deduce that its free cash flow fell well short of covering its statutory profit. In the last twelve months it actually had negative free cash flow, with an outflow of CN¥259m despite its profit of CN¥2.93b, mentioned above. It's worth noting that Zhongji Innolight generated positive FCF of CN¥1.3b a year ago, so at least they've done it in the past. The good news for shareholders is that Zhongji Innolight's accrual ratio was much better last year, so this year's poor reading might simply be a case of a short term mismatch between profit and FCF. Shareholders should look for improved cashflow relative to profit in the current year, if that is indeed the case.
That might leave you wondering what analysts are forecasting in terms of future profitability. Luckily, you can click here to see an interactive graph depicting future profitability, based on their estimates.
Our Take On Zhongji Innolight's Profit Performance
Zhongji Innolight didn't convert much of its profit to free cash flow in the last year, which some investors may consider rather suboptimal. Therefore, it seems possible to us that Zhongji Innolight's true underlying earnings power is actually less than its statutory profit. But the good news is that its EPS growth over the last three years has been very impressive. The goal of this article has been to assess how well we can rely on the statutory earnings to reflect the company's potential, but there is plenty more to consider. If you'd like to know more about Zhongji Innolight as a business, it's important to be aware of any risks it's facing. When we did our research, we found 2 warning signs for Zhongji Innolight (1 is a bit concerning!) that we believe deserve your full attention.
Today we've zoomed in on a single data point to better understand the nature of Zhongji Innolight's profit. But there is always more to discover if you are capable of focussing your mind on minutiae. For example, many people consider a high return on equity as an indication of favorable business economics, while others like to 'follow the money' and search out stocks that insiders are buying. So you may wish to see this free collection of companies boasting high return on equity, or this list of stocks that insiders are buying.
If you're looking to trade Zhongji Innolight, open an account with the lowest-cost platform trusted by professionals, Interactive Brokers.
With clients in over 200 countries and territories, and access to 160 markets, IBKR lets you trade stocks, options, futures, forex, bonds and funds from a single integrated account.
Enjoy no hidden fees, no account minimums, and FX conversion rates as low as 0.03%, far better than what most brokers offer.
Sponsored ContentValuation is complex, but we're here to simplify it.
Discover if Zhongji Innolight might be undervalued or overvalued with our detailed analysis, featuring fair value estimates, potential risks, dividends, insider trades, and its financial condition.
Access Free AnalysisHave feedback on this article? Concerned about the content? Get in touch with us directly. Alternatively, email editorial-team (at) simplywallst.com.
This article by Simply Wall St is general in nature. We provide commentary based on historical data and analyst forecasts only using an unbiased methodology and our articles are not intended to be financial advice. It does not constitute a recommendation to buy or sell any stock, and does not take account of your objectives, or your financial situation. We aim to bring you long-term focused analysis driven by fundamental data. Note that our analysis may not factor in the latest price-sensitive company announcements or qualitative material. Simply Wall St has no position in any stocks mentioned.
About SZSE:300308
Zhongji Innolight
Researches, develops, produces, and sells optical communication transceiver modules and optical devices in China.
Exceptional growth potential with outstanding track record.
Market Insights

Community Narratives

