- China
- /
- Communications
- /
- SZSE:300134
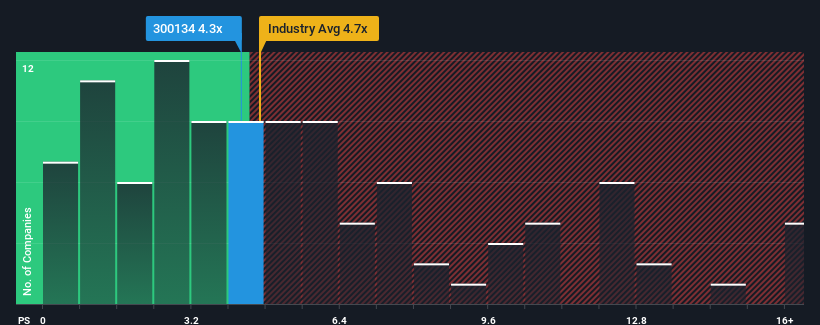
There's Reason For Concern Over Anhui Tatfook Technology Co., Ltd's (SZSE:300134) Massive 35% Price Jump

Despite an already strong run, Anhui Tatfook Technology Co., Ltd (SZSE:300134) shares have been powering on, with a gain of 35% in the last thirty days. Looking further back, the 17% rise over the last twelve months isn't too bad notwithstanding the strength over the last 30 days.
Although its price has surged higher, you could still be forgiven for feeling indifferent about Anhui Tatfook Technology's P/S ratio of 4.3x, since the median price-to-sales (or "P/S") ratio for the Communications industry in China is also close to 4.7x. However, investors might be overlooking a clear opportunity or potential setback if there is no rational basis for the P/S.
Check out our latest analysis for Anhui Tatfook Technology
What Does Anhui Tatfook Technology's Recent Performance Look Like?
For example, consider that Anhui Tatfook Technology's financial performance has been poor lately as its revenue has been in decline. Perhaps investors believe the recent revenue performance is enough to keep in line with the industry, which is keeping the P/S from dropping off. If you like the company, you'd at least be hoping this is the case so that you could potentially pick up some stock while it's not quite in favour.
We don't have analyst forecasts, but you can see how recent trends are setting up the company for the future by checking out our free report on Anhui Tatfook Technology's earnings, revenue and cash flow.How Is Anhui Tatfook Technology's Revenue Growth Trending?
In order to justify its P/S ratio, Anhui Tatfook Technology would need to produce growth that's similar to the industry.
Retrospectively, the last year delivered a frustrating 6.7% decrease to the company's top line. Regardless, revenue has managed to lift by a handy 14% in aggregate from three years ago, thanks to the earlier period of growth. Accordingly, while they would have preferred to keep the run going, shareholders would be roughly satisfied with the medium-term rates of revenue growth.
This is in contrast to the rest of the industry, which is expected to grow by 42% over the next year, materially higher than the company's recent medium-term annualised growth rates.
In light of this, it's curious that Anhui Tatfook Technology's P/S sits in line with the majority of other companies. Apparently many investors in the company are less bearish than recent times would indicate and aren't willing to let go of their stock right now. They may be setting themselves up for future disappointment if the P/S falls to levels more in line with recent growth rates.
What Does Anhui Tatfook Technology's P/S Mean For Investors?
Anhui Tatfook Technology appears to be back in favour with a solid price jump bringing its P/S back in line with other companies in the industry Typically, we'd caution against reading too much into price-to-sales ratios when settling on investment decisions, though it can reveal plenty about what other market participants think about the company.
We've established that Anhui Tatfook Technology's average P/S is a bit surprising since its recent three-year growth is lower than the wider industry forecast. Right now we are uncomfortable with the P/S as this revenue performance isn't likely to support a more positive sentiment for long. If recent medium-term revenue trends continue, the probability of a share price decline will become quite substantial, placing shareholders at risk.
And what about other risks? Every company has them, and we've spotted 1 warning sign for Anhui Tatfook Technology you should know about.
If you're unsure about the strength of Anhui Tatfook Technology's business, why not explore our interactive list of stocks with solid business fundamentals for some other companies you may have missed.
Mobile Infrastructure for Defense and Disaster
The next wave in robotics isn't humanoid. Its fully autonomous towers delivering 5G, ISR, and radar in under 30 minutes, anywhere.
Get the investor briefing before the next round of contracts
Sponsored On Behalf of CiTechNew: Manage All Your Stock Portfolios in One Place
We've created the ultimate portfolio companion for stock investors, and it's free.
• Connect an unlimited number of Portfolios and see your total in one currency
• Be alerted to new Warning Signs or Risks via email or mobile
• Track the Fair Value of your stocks
Have feedback on this article? Concerned about the content? Get in touch with us directly. Alternatively, email editorial-team (at) simplywallst.com.
This article by Simply Wall St is general in nature. We provide commentary based on historical data and analyst forecasts only using an unbiased methodology and our articles are not intended to be financial advice. It does not constitute a recommendation to buy or sell any stock, and does not take account of your objectives, or your financial situation. We aim to bring you long-term focused analysis driven by fundamental data. Note that our analysis may not factor in the latest price-sensitive company announcements or qualitative material. Simply Wall St has no position in any stocks mentioned.
About SZSE:300134
Anhui Tatfook Technology
Engages in the mobile communication equipment business and other businesses in the People's Republic of China and internationally.
Excellent balance sheet and slightly overvalued.
Market Insights

Weekly Picks

THE KINGDOM OF BROWN GOODS: WHY MGPI IS BEING CRUSHED BY INVENTORY & PRIMED FOR RESURRECTION


Why Vertical Aerospace (NYSE: EVTL) is Worth Possibly Over 13x its Current Price


The Quiet Giant That Became AI’s Power Grid
Recently Updated Narratives

Deep Value Multi Bagger Opportunity


A case for CA$31.80 (undiluted), aka 8,616% upside from CA$0.37 (an 86 bagger!).


Unicycive Therapeutics (Nasdaq: UNCY) – Preparing for a Second Shot at Bringing a New Kidney Treatment to Market (TEST)
Popular Narratives


MicroVision will explode future revenue by 380.37% with a vision towards success


NVDA: Expanding AI Demand Will Drive Major Data Center Investments Through 2026


Crazy Undervalued 42 Baggers Silver Play (Active & Running Mine)
Trending Discussion

