- China
- /
- Electronic Equipment and Components
- /
- SZSE:001298
There's No Escaping Shenzhen Best of Best Holdings Co.,Ltd.'s (SZSE:001298) Muted Revenues Despite A 36% Share Price Rise

Shenzhen Best of Best Holdings Co.,Ltd. (SZSE:001298) shares have had a really impressive month, gaining 36% after a shaky period beforehand. Looking back a bit further, it's encouraging to see the stock is up 59% in the last year.
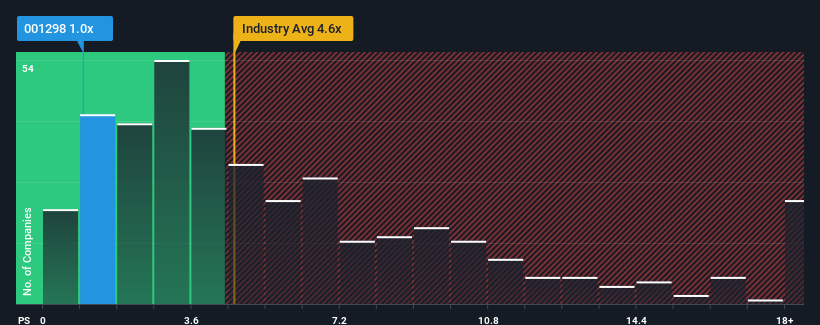
In spite of the firm bounce in price, Shenzhen Best of Best HoldingsLtd may still be sending very bullish signals at the moment with its price-to-sales (or "P/S") ratio of 1x, since almost half of all companies in the Electronic industry in China have P/S ratios greater than 4.6x and even P/S higher than 9x are not unusual. However, the P/S might be quite low for a reason and it requires further investigation to determine if it's justified.
Check out our latest analysis for Shenzhen Best of Best HoldingsLtd
How Has Shenzhen Best of Best HoldingsLtd Performed Recently?
The revenue growth achieved at Shenzhen Best of Best HoldingsLtd over the last year would be more than acceptable for most companies. It might be that many expect the respectable revenue performance to degrade substantially, which has repressed the P/S. Those who are bullish on Shenzhen Best of Best HoldingsLtd will be hoping that this isn't the case, so that they can pick up the stock at a lower valuation.
Although there are no analyst estimates available for Shenzhen Best of Best HoldingsLtd, take a look at this free data-rich visualisation to see how the company stacks up on earnings, revenue and cash flow.How Is Shenzhen Best of Best HoldingsLtd's Revenue Growth Trending?
There's an inherent assumption that a company should far underperform the industry for P/S ratios like Shenzhen Best of Best HoldingsLtd's to be considered reasonable.
Retrospectively, the last year delivered an exceptional 21% gain to the company's top line. Still, revenue has fallen 1.3% in total from three years ago, which is quite disappointing. So unfortunately, we have to acknowledge that the company has not done a great job of growing revenues over that time.
Weighing that medium-term revenue trajectory against the broader industry's one-year forecast for expansion of 26% shows it's an unpleasant look.
With this information, we are not surprised that Shenzhen Best of Best HoldingsLtd is trading at a P/S lower than the industry. Nonetheless, there's no guarantee the P/S has reached a floor yet with revenue going in reverse. Even just maintaining these prices could be difficult to achieve as recent revenue trends are already weighing down the shares.
What We Can Learn From Shenzhen Best of Best HoldingsLtd's P/S?
Shenzhen Best of Best HoldingsLtd's recent share price jump still sees fails to bring its P/S alongside the industry median. We'd say the price-to-sales ratio's power isn't primarily as a valuation instrument but rather to gauge current investor sentiment and future expectations.
Our examination of Shenzhen Best of Best HoldingsLtd confirms that the company's shrinking revenue over the past medium-term is a key factor in its low price-to-sales ratio, given the industry is projected to grow. Right now shareholders are accepting the low P/S as they concede future revenue probably won't provide any pleasant surprises either. Unless the recent medium-term conditions improve, they will continue to form a barrier for the share price around these levels.
Having said that, be aware Shenzhen Best of Best HoldingsLtd is showing 3 warning signs in our investment analysis, and 1 of those makes us a bit uncomfortable.
Of course, profitable companies with a history of great earnings growth are generally safer bets. So you may wish to see this free collection of other companies that have reasonable P/E ratios and have grown earnings strongly.
The New Payments ETF Is Live on NASDAQ:
Money is moving to real-time rails, and a newly listed ETF now gives investors direct exposure. Fast settlement. Institutional custody. Simple access.
Explore how this launch could reshape portfolios
Sponsored ContentNew: Manage All Your Stock Portfolios in One Place
We've created the ultimate portfolio companion for stock investors, and it's free.
• Connect an unlimited number of Portfolios and see your total in one currency
• Be alerted to new Warning Signs or Risks via email or mobile
• Track the Fair Value of your stocks
Have feedback on this article? Concerned about the content? Get in touch with us directly. Alternatively, email editorial-team (at) simplywallst.com.
This article by Simply Wall St is general in nature. We provide commentary based on historical data and analyst forecasts only using an unbiased methodology and our articles are not intended to be financial advice. It does not constitute a recommendation to buy or sell any stock, and does not take account of your objectives, or your financial situation. We aim to bring you long-term focused analysis driven by fundamental data. Note that our analysis may not factor in the latest price-sensitive company announcements or qualitative material. Simply Wall St has no position in any stocks mentioned.
About SZSE:001298
Shenzhen Best of Best HoldingsLtd
Distributes electronic component in the People's Republic of China.
Adequate balance sheet with slight risk.
Market Insights

Weekly Picks

Early mover in a fast growing industry. Likely to experience share price volatility as they scale


A case for CA$31.80 (undiluted), aka 8,616% upside from CA$0.37 (an 86 bagger!).


Moderation and Stabilisation: HOLD: Fair Price based on a 4-year Cycle is $12.08
Recently Updated Narratives

UnitedHealth Stock: Why Scale, Data, and Integration Still Matter in U.S. Healthcare

A case for USD $14.81 per share based on book value. Be warned, this is a micro-cap dependent on a single mine.

Occidental Petroleum to Become Fairly Priced at $68.29 According to Future Projections
Popular Narratives


MicroVision will explode future revenue by 380.37% with a vision towards success


Crazy Undervalued 42 Baggers Silver Play (Active & Running Mine)


