
Advertisement
- China
- /
- Electronic Equipment and Components
- /
- SHSE:688337
Calculating The Intrinsic Value Of Rigol Technologies Co., Ltd. (SHSE:688337)
Key Insights
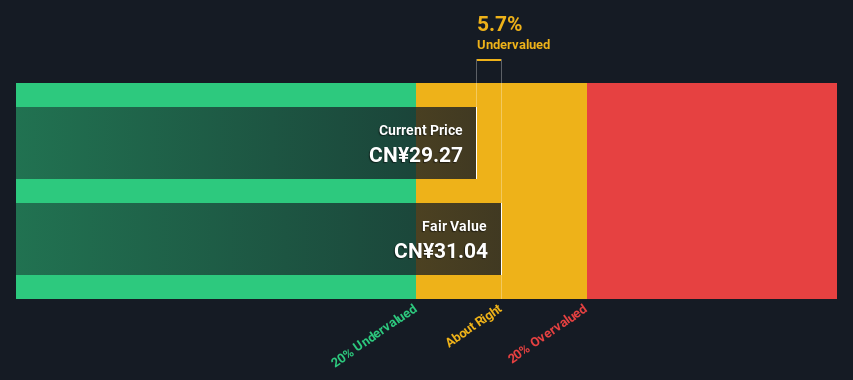
- Using the 2 Stage Free Cash Flow to Equity, Rigol Technologies fair value estimate is CN¥31.04
- With CN¥29.27 share price, Rigol Technologies appears to be trading close to its estimated fair value
- The CN¥47.48 analyst price target for 688337 is 53% more than our estimate of fair value
Today we'll do a simple run through of a valuation method used to estimate the attractiveness of Rigol Technologies Co., Ltd. (SHSE:688337) as an investment opportunity by taking the forecast future cash flows of the company and discounting them back to today's value. One way to achieve this is by employing the Discounted Cash Flow (DCF) model. It may sound complicated, but actually it is quite simple!
We would caution that there are many ways of valuing a company and, like the DCF, each technique has advantages and disadvantages in certain scenarios. Anyone interested in learning a bit more about intrinsic value should have a read of the Simply Wall St analysis model.
View our latest analysis for Rigol Technologies
The Method
We're using the 2-stage growth model, which simply means we take in account two stages of company's growth. In the initial period the company may have a higher growth rate and the second stage is usually assumed to have a stable growth rate. To start off with, we need to estimate the next ten years of cash flows. Where possible we use analyst estimates, but when these aren't available we extrapolate the previous free cash flow (FCF) from the last estimate or reported value. We assume companies with shrinking free cash flow will slow their rate of shrinkage, and that companies with growing free cash flow will see their growth rate slow, over this period. We do this to reflect that growth tends to slow more in the early years than it does in later years.
Generally we assume that a dollar today is more valuable than a dollar in the future, so we need to discount the sum of these future cash flows to arrive at a present value estimate:
10-year free cash flow (FCF) forecast
| 2024 | 2025 | 2026 | 2027 | 2028 | 2029 | 2030 | 2031 | 2032 | 2033 | |
| Levered FCF (CN¥, Millions) | -CN¥16.0m | CN¥61.0m | CN¥138.0m | CN¥208.0m | CN¥283.8m | CN¥358.6m | CN¥427.9m | CN¥489.6m | CN¥543.4m | CN¥589.9m |
| Growth Rate Estimate Source | Analyst x1 | Analyst x1 | Analyst x1 | Est @ 50.75% | Est @ 36.41% | Est @ 26.37% | Est @ 19.34% | Est @ 14.42% | Est @ 10.98% | Est @ 8.56% |
| Present Value (CN¥, Millions) Discounted @ 9.1% | -CN¥14.7 | CN¥51.2 | CN¥106 | CN¥147 | CN¥183 | CN¥212 | CN¥232 | CN¥243 | CN¥247 | CN¥246 |
("Est" = FCF growth rate estimated by Simply Wall St)
Present Value of 10-year Cash Flow (PVCF) = CN¥1.7b
After calculating the present value of future cash flows in the initial 10-year period, we need to calculate the Terminal Value, which accounts for all future cash flows beyond the first stage. For a number of reasons a very conservative growth rate is used that cannot exceed that of a country's GDP growth. In this case we have used the 5-year average of the 10-year government bond yield (2.9%) to estimate future growth. In the same way as with the 10-year 'growth' period, we discount future cash flows to today's value, using a cost of equity of 9.1%.
Terminal Value (TV)= FCF2033 × (1 + g) ÷ (r – g) = CN¥590m× (1 + 2.9%) ÷ (9.1%– 2.9%) = CN¥9.8b
Present Value of Terminal Value (PVTV)= TV / (1 + r)10= CN¥9.8b÷ ( 1 + 9.1%)10= CN¥4.1b
The total value, or equity value, is then the sum of the present value of the future cash flows, which in this case is CN¥5.7b. The last step is to then divide the equity value by the number of shares outstanding. Relative to the current share price of CN¥29.3, the company appears about fair value at a 5.7% discount to where the stock price trades currently. Remember though, that this is just an approximate valuation, and like any complex formula - garbage in, garbage out.
Important Assumptions
The calculation above is very dependent on two assumptions. The first is the discount rate and the other is the cash flows. If you don't agree with these result, have a go at the calculation yourself and play with the assumptions. The DCF also does not consider the possible cyclicality of an industry, or a company's future capital requirements, so it does not give a full picture of a company's potential performance. Given that we are looking at Rigol Technologies as potential shareholders, the cost of equity is used as the discount rate, rather than the cost of capital (or weighted average cost of capital, WACC) which accounts for debt. In this calculation we've used 9.1%, which is based on a levered beta of 1.100. Beta is a measure of a stock's volatility, compared to the market as a whole. We get our beta from the industry average beta of globally comparable companies, with an imposed limit between 0.8 and 2.0, which is a reasonable range for a stable business.
SWOT Analysis for Rigol Technologies
Strength
- Earnings growth over the past year exceeded the industry.
- Debt is well covered by earnings.
Weakness
- Earnings growth over the past year is below its 5-year average.
- Dividend is low compared to the top 25% of dividend payers in the Electronic market.
- Shareholders have been diluted in the past year.
Opportunity
- Annual earnings are forecast to grow faster than the Chinese market.
- Current share price is below our estimate of fair value.
Threat
- Debt is not well covered by operating cash flow.
- Paying a dividend but company has no free cash flows.
Looking Ahead:
Although the valuation of a company is important, it ideally won't be the sole piece of analysis you scrutinize for a company. The DCF model is not a perfect stock valuation tool. Instead the best use for a DCF model is to test certain assumptions and theories to see if they would lead to the company being undervalued or overvalued. For instance, if the terminal value growth rate is adjusted slightly, it can dramatically alter the overall result. For Rigol Technologies, there are three important elements you should look at:
- Risks: For example, we've discovered 3 warning signs for Rigol Technologies (1 can't be ignored!) that you should be aware of before investing here.
- Future Earnings: How does 688337's growth rate compare to its peers and the wider market? Dig deeper into the analyst consensus number for the upcoming years by interacting with our free analyst growth expectation chart.
- Other High Quality Alternatives: Do you like a good all-rounder? Explore our interactive list of high quality stocks to get an idea of what else is out there you may be missing!
PS. The Simply Wall St app conducts a discounted cash flow valuation for every stock on the SHSE every day. If you want to find the calculation for other stocks just search here.
New: AI Stock Screener & Alerts
Our new AI Stock Screener scans the market every day to uncover opportunities.
• Dividend Powerhouses (3%+ Yield)
• Undervalued Small Caps with Insider Buying
• High growth Tech and AI Companies
Or build your own from over 50 metrics.
Have feedback on this article? Concerned about the content? Get in touch with us directly. Alternatively, email editorial-team (at) simplywallst.com.
This article by Simply Wall St is general in nature. We provide commentary based on historical data and analyst forecasts only using an unbiased methodology and our articles are not intended to be financial advice. It does not constitute a recommendation to buy or sell any stock, and does not take account of your objectives, or your financial situation. We aim to bring you long-term focused analysis driven by fundamental data. Note that our analysis may not factor in the latest price-sensitive company announcements or qualitative material. Simply Wall St has no position in any stocks mentioned.
About SHSE:688337
Rigol Technologies
Engages in the research, development, manufacturing, and sale of electronic testing and measuring instruments and accessories in China and internationally.
Reasonable growth potential with adequate balance sheet.
Market Insights

Advertisement
Weekly Picks
FA

FAI on Arabian Internet and Communication Services ·
Solutions by stc: 34% Upside in Saudi's Digital Transformation Leader
Fair Value:ر.س342.2335.3% undervalued
9 followersusers have followed this narrative
1 commentusers have commented on this narrative
3 likesusers have liked this narrative
RO


RobertoAllende on NVIDIA ·
The AI Infrastructure Giant Grows Into Its Valuation
Fair Value:US$345.0747.9% undervalued
27 followersusers have followed this narrative
28 commentsusers have commented on this narrative
21 likesusers have liked this narrative
Recently Updated Narratives
TA


Talos on Archer Aviation ·
The Industrialist of the Skies – Scaling with "Automotive DNA
Fair Value:US$16.3254.3% undervalued
1 followerusers have followed this narrative
0 commentsusers have commented on this narrative
0 likesusers have liked this narrative
TA

Talos on Rocket Lab ·
The "End-to-End" Space Prime – The Only Real Competitor to SpaceX
Fair Value:US$80.4749.8% undervalued
1 followerusers have followed this narrative
0 commentsusers have commented on this narrative
0 likesusers have liked this narrative
HE


heliogabal on Aya Gold & Silver ·
De-Risked Production Ramp with Exceptional Silver Price Leverage
Fair Value:CA$5061.5% undervalued
1 followerusers have followed this narrative
0 commentsusers have commented on this narrative
0 likesusers have liked this narrative
Popular Narratives
TH

TheWallstreetKing on MicroVision ·
MicroVision will explode future revenue by 380.37% with a vision towards success
Fair Value:US$6098.6% undervalued
110 followersusers have followed this narrative
11 commentsusers have commented on this narrative
22 likesusers have liked this narrative
AN

AnalystConsensusTarget on NVIDIA ·
NVDA: Expanding AI Demand Will Drive Major Data Center Investments Through 2026
Fair Value:US$250.3928.1% undervalued
943 followersusers have followed this narrative
6 commentsusers have commented on this narrative
24 likesusers have liked this narrative
OS


oscargarcia on Alphabet ·
The company that turned a verb into a global necessity and basically runs the modern internet, digital ads, smartphones, maps, and AI.
Fair Value:US$3407.4% undervalued
145 followersusers have followed this narrative
6 commentsusers have commented on this narrative
18 likesusers have liked this narrative