
Advertisement
- China
- /
- Semiconductors
- /
- SZSE:300554
Risks Still Elevated At These Prices As NanJing Sanchao Advanced Materials Co.,Ltd. (SZSE:300554) Shares Dive 26%
NanJing Sanchao Advanced Materials Co.,Ltd. (SZSE:300554) shares have had a horrible month, losing 26% after a relatively good period beforehand. Still, a bad month hasn't completely ruined the past year with the stock gaining 26%, which is great even in a bull market.
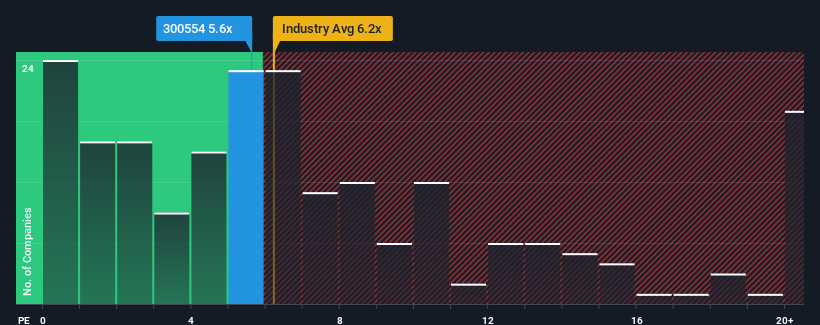
Even after such a large drop in price, there still wouldn't be many who think NanJing Sanchao Advanced MaterialsLtd's price-to-sales (or "P/S") ratio of 5.6x is worth a mention when the median P/S in China's Semiconductor industry is similar at about 6.2x. Although, it's not wise to simply ignore the P/S without explanation as investors may be disregarding a distinct opportunity or a costly mistake.
View our latest analysis for NanJing Sanchao Advanced MaterialsLtd
How NanJing Sanchao Advanced MaterialsLtd Has Been Performing
Revenue has risen firmly for NanJing Sanchao Advanced MaterialsLtd recently, which is pleasing to see. One possibility is that the P/S is moderate because investors think this respectable revenue growth might not be enough to outperform the broader industry in the near future. If you like the company, you'd be hoping this isn't the case so that you could potentially pick up some stock while it's not quite in favour.
We don't have analyst forecasts, but you can see how recent trends are setting up the company for the future by checking out our free report on NanJing Sanchao Advanced MaterialsLtd's earnings, revenue and cash flow.Do Revenue Forecasts Match The P/S Ratio?
NanJing Sanchao Advanced MaterialsLtd's P/S ratio would be typical for a company that's only expected to deliver moderate growth, and importantly, perform in line with the industry.
Retrospectively, the last year delivered a decent 12% gain to the company's revenues. Pleasingly, revenue has also lifted 87% in aggregate from three years ago, partly thanks to the last 12 months of growth. Accordingly, shareholders would have definitely welcomed those medium-term rates of revenue growth.
Comparing the recent medium-term revenue trends against the industry's one-year growth forecast of 35% shows it's noticeably less attractive.
With this in mind, we find it intriguing that NanJing Sanchao Advanced MaterialsLtd's P/S is comparable to that of its industry peers. It seems most investors are ignoring the fairly limited recent growth rates and are willing to pay up for exposure to the stock. They may be setting themselves up for future disappointment if the P/S falls to levels more in line with recent growth rates.
What We Can Learn From NanJing Sanchao Advanced MaterialsLtd's P/S?
With its share price dropping off a cliff, the P/S for NanJing Sanchao Advanced MaterialsLtd looks to be in line with the rest of the Semiconductor industry. Typically, we'd caution against reading too much into price-to-sales ratios when settling on investment decisions, though it can reveal plenty about what other market participants think about the company.
We've established that NanJing Sanchao Advanced MaterialsLtd's average P/S is a bit surprising since its recent three-year growth is lower than the wider industry forecast. Right now we are uncomfortable with the P/S as this revenue performance isn't likely to support a more positive sentiment for long. Unless the recent medium-term conditions improve, it's hard to accept the current share price as fair value.
Before you settle on your opinion, we've discovered 1 warning sign for NanJing Sanchao Advanced MaterialsLtd that you should be aware of.
If companies with solid past earnings growth is up your alley, you may wish to see this free collection of other companies with strong earnings growth and low P/E ratios.
Valuation is complex, but we're here to simplify it.
Discover if NanJing Sanchao Advanced MaterialsLtd might be undervalued or overvalued with our detailed analysis, featuring fair value estimates, potential risks, dividends, insider trades, and its financial condition.
Access Free AnalysisHave feedback on this article? Concerned about the content? Get in touch with us directly. Alternatively, email editorial-team (at) simplywallst.com.
This article by Simply Wall St is general in nature. We provide commentary based on historical data and analyst forecasts only using an unbiased methodology and our articles are not intended to be financial advice. It does not constitute a recommendation to buy or sell any stock, and does not take account of your objectives, or your financial situation. We aim to bring you long-term focused analysis driven by fundamental data. Note that our analysis may not factor in the latest price-sensitive company announcements or qualitative material. Simply Wall St has no position in any stocks mentioned.
Have feedback on this article? Concerned about the content? Get in touch with us directly. Alternatively, email editorial-team@simplywallst.com
About SZSE:300554
NanJing Sanchao Advanced MaterialsLtd
NanJing Sanchao Advanced Materials Co.,Ltd.
Excellent balance sheet with minimal risk.
Market Insights

Advertisement
Community Narratives
MicroVision will explode future revenue by 380.37% with a vision towards success
Fair Value US$60.00|98.4% undervalued
TH
Community Contributor
The Indispensable Artery for a New North American Economy
Fair Value CA$132.87|1.1% undervalued
TI
Community Contributor