- China
- /
- Semiconductors
- /
- SZSE:300162
Ledman Optoelectronic Co., Ltd.'s (SZSE:300162) Share Price Boosted 79% But Its Business Prospects Need A Lift Too


The Ledman Optoelectronic Co., Ltd. (SZSE:300162) share price has done very well over the last month, posting an excellent gain of 79%. Looking further back, the 14% rise over the last twelve months isn't too bad notwithstanding the strength over the last 30 days.
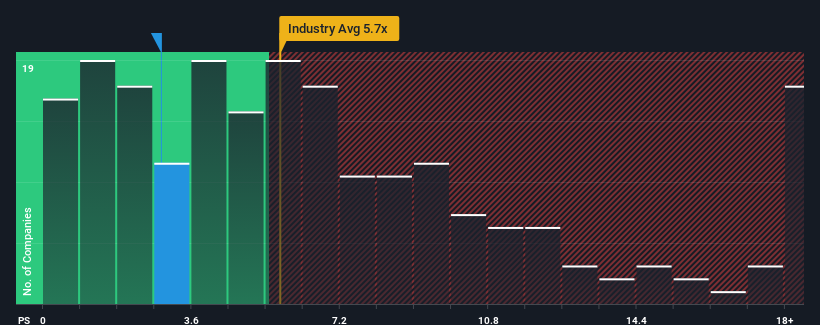
Although its price has surged higher, Ledman Optoelectronic may still look like a strong buying opportunity at present with its price-to-sales (or "P/S") ratio of 2.9x, considering almost half of all companies in the Semiconductor industry in China have P/S ratios greater than 5.7x and even P/S higher than 10x aren't out of the ordinary. Although, it's not wise to just take the P/S at face value as there may be an explanation why it's so limited.
Check out our latest analysis for Ledman Optoelectronic
What Does Ledman Optoelectronic's Recent Performance Look Like?
Ledman Optoelectronic has been doing a good job lately as it's been growing revenue at a solid pace. One possibility is that the P/S is low because investors think this respectable revenue growth might actually underperform the broader industry in the near future. If you like the company, you'd be hoping this isn't the case so that you could potentially pick up some stock while it's out of favour.
We don't have analyst forecasts, but you can see how recent trends are setting up the company for the future by checking out our free report on Ledman Optoelectronic's earnings, revenue and cash flow.Do Revenue Forecasts Match The Low P/S Ratio?
Ledman Optoelectronic's P/S ratio would be typical for a company that's expected to deliver very poor growth or even falling revenue, and importantly, perform much worse than the industry.
Taking a look back first, we see that the company managed to grow revenues by a handy 8.2% last year. The latest three year period has also seen an excellent 31% overall rise in revenue, aided somewhat by its short-term performance. Accordingly, shareholders would have definitely welcomed those medium-term rates of revenue growth.
Comparing the recent medium-term revenue trends against the industry's one-year growth forecast of 36% shows it's noticeably less attractive.
With this in consideration, it's easy to understand why Ledman Optoelectronic's P/S falls short of the mark set by its industry peers. Apparently many shareholders weren't comfortable holding on to something they believe will continue to trail the wider industry.
What Does Ledman Optoelectronic's P/S Mean For Investors?
Shares in Ledman Optoelectronic have risen appreciably however, its P/S is still subdued. Generally, our preference is to limit the use of the price-to-sales ratio to establishing what the market thinks about the overall health of a company.
Our examination of Ledman Optoelectronic confirms that the company's revenue trends over the past three-year years are a key factor in its low price-to-sales ratio, as we suspected, given they fall short of current industry expectations. At this stage investors feel the potential for an improvement in revenue isn't great enough to justify a higher P/S ratio. If recent medium-term revenue trends continue, it's hard to see the share price experience a reversal of fortunes anytime soon.
Before you take the next step, you should know about the 2 warning signs for Ledman Optoelectronic (1 is potentially serious!) that we have uncovered.
If strong companies turning a profit tickle your fancy, then you'll want to check out this free list of interesting companies that trade on a low P/E (but have proven they can grow earnings).
New: AI Stock Screener & Alerts
Our new AI Stock Screener scans the market every day to uncover opportunities.
• Dividend Powerhouses (3%+ Yield)
• Undervalued Small Caps with Insider Buying
• High growth Tech and AI Companies
Or build your own from over 50 metrics.
Have feedback on this article? Concerned about the content? Get in touch with us directly. Alternatively, email editorial-team (at) simplywallst.com.
This article by Simply Wall St is general in nature. We provide commentary based on historical data and analyst forecasts only using an unbiased methodology and our articles are not intended to be financial advice. It does not constitute a recommendation to buy or sell any stock, and does not take account of your objectives, or your financial situation. We aim to bring you long-term focused analysis driven by fundamental data. Note that our analysis may not factor in the latest price-sensitive company announcements or qualitative material. Simply Wall St has no position in any stocks mentioned.
About SZSE:300162
Ledman Optoelectronic
Provides LED stadium display products and solutions in the People’s Republic of China.
Excellent balance sheet and slightly overvalued.
