- China
- /
- Semiconductors
- /
- SZSE:300102
There's No Escaping Xiamen Changelight Co., Ltd.'s (SZSE:300102) Muted Revenues Despite A 29% Share Price Rise


Those holding Xiamen Changelight Co., Ltd. (SZSE:300102) shares would be relieved that the share price has rebounded 29% in the last thirty days, but it needs to keep going to repair the recent damage it has caused to investor portfolios. Not all shareholders will be feeling jubilant, since the share price is still down a very disappointing 11% in the last twelve months.
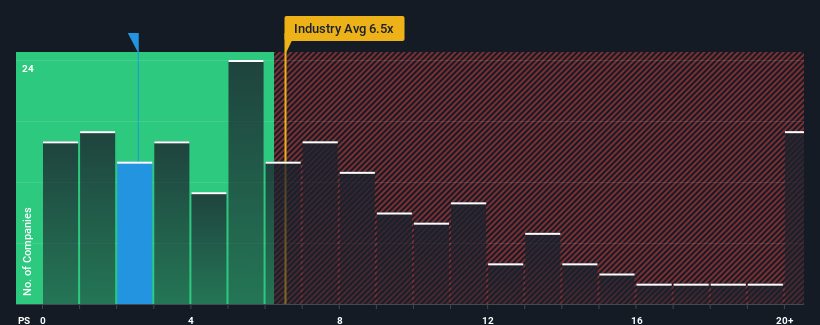
Even after such a large jump in price, Xiamen Changelight's price-to-sales (or "P/S") ratio of 2.6x might still make it look like a strong buy right now compared to the wider Semiconductor industry in China, where around half of the companies have P/S ratios above 6.5x and even P/S above 12x are quite common. Nonetheless, we'd need to dig a little deeper to determine if there is a rational basis for the highly reduced P/S.
Check out our latest analysis for Xiamen Changelight
What Does Xiamen Changelight's P/S Mean For Shareholders?
Recent times have been quite advantageous for Xiamen Changelight as its revenue has been rising very briskly. One possibility is that the P/S ratio is low because investors think this strong revenue growth might actually underperform the broader industry in the near future. If that doesn't eventuate, then existing shareholders have reason to be quite optimistic about the future direction of the share price.
Although there are no analyst estimates available for Xiamen Changelight, take a look at this free data-rich visualisation to see how the company stacks up on earnings, revenue and cash flow.Do Revenue Forecasts Match The Low P/S Ratio?
In order to justify its P/S ratio, Xiamen Changelight would need to produce anemic growth that's substantially trailing the industry.
If we review the last year of revenue growth, the company posted a terrific increase of 42%. The strong recent performance means it was also able to grow revenue by 93% in total over the last three years. Accordingly, shareholders would have definitely welcomed those medium-term rates of revenue growth.
Comparing that to the industry, which is predicted to deliver 37% growth in the next 12 months, the company's momentum is weaker, based on recent medium-term annualised revenue results.
With this in consideration, it's easy to understand why Xiamen Changelight's P/S falls short of the mark set by its industry peers. It seems most investors are expecting to see the recent limited growth rates continue into the future and are only willing to pay a reduced amount for the stock.
The Final Word
Even after such a strong price move, Xiamen Changelight's P/S still trails the rest of the industry. Using the price-to-sales ratio alone to determine if you should sell your stock isn't sensible, however it can be a practical guide to the company's future prospects.
Our examination of Xiamen Changelight confirms that the company's revenue trends over the past three-year years are a key factor in its low price-to-sales ratio, as we suspected, given they fall short of current industry expectations. At this stage investors feel the potential for an improvement in revenue isn't great enough to justify a higher P/S ratio. If recent medium-term revenue trends continue, it's hard to see the share price experience a reversal of fortunes anytime soon.
It is also worth noting that we have found 1 warning sign for Xiamen Changelight that you need to take into consideration.
It's important to make sure you look for a great company, not just the first idea you come across. So if growing profitability aligns with your idea of a great company, take a peek at this free list of interesting companies with strong recent earnings growth (and a low P/E).
New: AI Stock Screener & Alerts
Our new AI Stock Screener scans the market every day to uncover opportunities.
• Dividend Powerhouses (3%+ Yield)
• Undervalued Small Caps with Insider Buying
• High growth Tech and AI Companies
Or build your own from over 50 metrics.
Have feedback on this article? Concerned about the content? Get in touch with us directly. Alternatively, email editorial-team (at) simplywallst.com.
This article by Simply Wall St is general in nature. We provide commentary based on historical data and analyst forecasts only using an unbiased methodology and our articles are not intended to be financial advice. It does not constitute a recommendation to buy or sell any stock, and does not take account of your objectives, or your financial situation. We aim to bring you long-term focused analysis driven by fundamental data. Note that our analysis may not factor in the latest price-sensitive company announcements or qualitative material. Simply Wall St has no position in any stocks mentioned.
About SZSE:300102
Xiamen Changelight
Researches, develops, produces, and sells compound semiconductor devices in China and internationally.
Excellent balance sheet with questionable track record.

