- China
- /
- Semiconductors
- /
- SZSE:001270
Zhejiang Chengchang Technology Co., Ltd.'s (SZSE:001270) 26% Cheaper Price Remains In Tune With Revenues

The Zhejiang Chengchang Technology Co., Ltd. (SZSE:001270) share price has softened a substantial 26% over the previous 30 days, handing back much of the gains the stock has made lately. The drop over the last 30 days has capped off a tough year for shareholders, with the share price down 22% in that time.
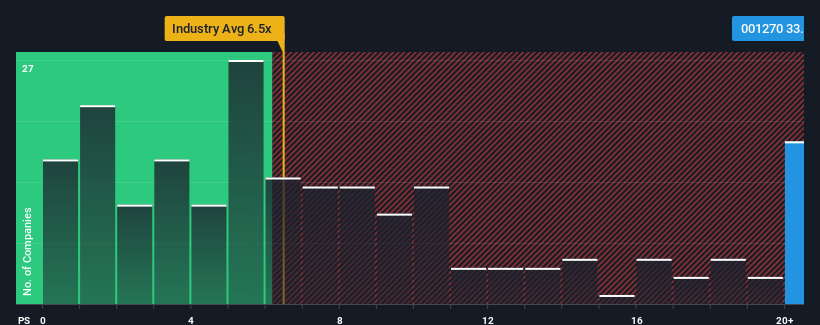
In spite of the heavy fall in price, Zhejiang Chengchang Technology's price-to-sales (or "P/S") ratio of 33x might still make it look like a strong sell right now compared to other companies in the Semiconductor industry in China, where around half of the companies have P/S ratios below 6.5x and even P/S below 3x are quite common. Although, it's not wise to just take the P/S at face value as there may be an explanation why it's so lofty.
View our latest analysis for Zhejiang Chengchang Technology

How Has Zhejiang Chengchang Technology Performed Recently?
Zhejiang Chengchang Technology could be doing better as its revenue has been going backwards lately while most other companies have been seeing positive revenue growth. Perhaps the market is expecting the poor revenue to reverse, justifying it's current high P/S.. However, if this isn't the case, investors might get caught out paying too much for the stock.
If you'd like to see what analysts are forecasting going forward, you should check out our free report on Zhejiang Chengchang Technology.How Is Zhejiang Chengchang Technology's Revenue Growth Trending?
Zhejiang Chengchang Technology's P/S ratio would be typical for a company that's expected to deliver very strong growth, and importantly, perform much better than the industry.
In reviewing the last year of financials, we were disheartened to see the company's revenues fell to the tune of 33%. Unfortunately, that's brought it right back to where it started three years ago with revenue growth being virtually non-existent overall during that time. So it appears to us that the company has had a mixed result in terms of growing revenue over that time.
Turning to the outlook, the next year should generate growth of 126% as estimated by the six analysts watching the company. With the industry only predicted to deliver 54%, the company is positioned for a stronger revenue result.
With this in mind, it's not hard to understand why Zhejiang Chengchang Technology's P/S is high relative to its industry peers. Apparently shareholders aren't keen to offload something that is potentially eyeing a more prosperous future.
The Final Word
Even after such a strong price drop, Zhejiang Chengchang Technology's P/S still exceeds the industry median significantly. Generally, our preference is to limit the use of the price-to-sales ratio to establishing what the market thinks about the overall health of a company.
Our look into Zhejiang Chengchang Technology shows that its P/S ratio remains high on the merit of its strong future revenues. At this stage investors feel the potential for a deterioration in revenues is quite remote, justifying the elevated P/S ratio. It's hard to see the share price falling strongly in the near future under these circumstances.
A lot of potential risks can sit within a company's balance sheet. You can assess many of the main risks through our free balance sheet analysis for Zhejiang Chengchang Technology with six simple checks.
Of course, profitable companies with a history of great earnings growth are generally safer bets. So you may wish to see this free collection of other companies that have reasonable P/E ratios and have grown earnings strongly.
If you're looking to trade Zhejiang Chengchang Technology, open an account with the lowest-cost platform trusted by professionals, Interactive Brokers.
With clients in over 200 countries and territories, and access to 160 markets, IBKR lets you trade stocks, options, futures, forex, bonds and funds from a single integrated account.
Enjoy no hidden fees, no account minimums, and FX conversion rates as low as 0.03%, far better than what most brokers offer.
Sponsored ContentValuation is complex, but we're here to simplify it.
Discover if Zhejiang Chengchang Technology might be undervalued or overvalued with our detailed analysis, featuring fair value estimates, potential risks, dividends, insider trades, and its financial condition.
Access Free AnalysisHave feedback on this article? Concerned about the content? Get in touch with us directly. Alternatively, email editorial-team (at) simplywallst.com.
This article by Simply Wall St is general in nature. We provide commentary based on historical data and analyst forecasts only using an unbiased methodology and our articles are not intended to be financial advice. It does not constitute a recommendation to buy or sell any stock, and does not take account of your objectives, or your financial situation. We aim to bring you long-term focused analysis driven by fundamental data. Note that our analysis may not factor in the latest price-sensitive company announcements or qualitative material. Simply Wall St has no position in any stocks mentioned.
About SZSE:001270
Zhejiang Chengchang Technology
Engages in research, development, production, and sale of microwave and millimeter-wave analog phased array T/R chips in China.
Flawless balance sheet with high growth potential.
Market Insights
Community Narratives


