- China
- /
- Specialty Stores
- /
- SZSE:300736
Subdued Growth No Barrier To BYBON Group Company Limited (SZSE:300736) With Shares Advancing 29%


Those holding BYBON Group Company Limited (SZSE:300736) shares would be relieved that the share price has rebounded 29% in the last thirty days, but it needs to keep going to repair the recent damage it has caused to investor portfolios. Unfortunately, the gains of the last month did little to right the losses of the last year with the stock still down 27% over that time.
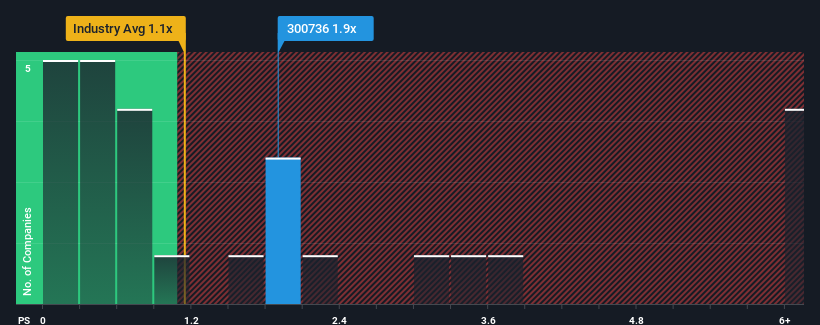
Following the firm bounce in price, you could be forgiven for thinking BYBON Group is a stock not worth researching with a price-to-sales ratios (or "P/S") of 1.9x, considering almost half the companies in China's Specialty Retail industry have P/S ratios below 1.1x. However, the P/S might be high for a reason and it requires further investigation to determine if it's justified.
View our latest analysis for BYBON Group
How Has BYBON Group Performed Recently?
BYBON Group certainly has been doing a great job lately as it's been growing its revenue at a really rapid pace. Perhaps the market is expecting future revenue performance to outperform the wider market, which has seemingly got people interested in the stock. However, if this isn't the case, investors might get caught out paying too much for the stock.
Although there are no analyst estimates available for BYBON Group, take a look at this free data-rich visualisation to see how the company stacks up on earnings, revenue and cash flow.What Are Revenue Growth Metrics Telling Us About The High P/S?
The only time you'd be truly comfortable seeing a P/S as high as BYBON Group's is when the company's growth is on track to outshine the industry.
If we review the last year of revenue growth, the company posted a terrific increase of 35%. The strong recent performance means it was also able to grow revenue by 49% in total over the last three years. Therefore, it's fair to say the revenue growth recently has been superb for the company.
Comparing that to the industry, which is predicted to deliver 15% growth in the next 12 months, the company's momentum is pretty similar based on recent medium-term annualised revenue results.
With this information, we find it interesting that BYBON Group is trading at a high P/S compared to the industry. Apparently many investors in the company are more bullish than recent times would indicate and aren't willing to let go of their stock right now. Nevertheless, they may be setting themselves up for future disappointment if the P/S falls to levels more in line with recent growth rates.
What Does BYBON Group's P/S Mean For Investors?
BYBON Group shares have taken a big step in a northerly direction, but its P/S is elevated as a result. We'd say the price-to-sales ratio's power isn't primarily as a valuation instrument but rather to gauge current investor sentiment and future expectations.
We didn't expect to see BYBON Group trade at such a high P/S considering its last three-year revenue growth has only been on par with the rest of the industry. When we see average revenue with industry-like growth combined with a high P/S, we suspect the share price is at risk of declining, bringing the P/S back in line with the industry too. Unless the recent medium-term conditions improve, it's challenging to accept these prices as being reasonable.
Before you take the next step, you should know about the 1 warning sign for BYBON Group that we have uncovered.
It's important to make sure you look for a great company, not just the first idea you come across. So if growing profitability aligns with your idea of a great company, take a peek at this free list of interesting companies with strong recent earnings growth (and a low P/E).
Valuation is complex, but we're here to simplify it.
Discover if BYBON Group might be undervalued or overvalued with our detailed analysis, featuring fair value estimates, potential risks, dividends, insider trades, and its financial condition.
Access Free AnalysisHave feedback on this article? Concerned about the content? Get in touch with us directly. Alternatively, email editorial-team (at) simplywallst.com.
This article by Simply Wall St is general in nature. We provide commentary based on historical data and analyst forecasts only using an unbiased methodology and our articles are not intended to be financial advice. It does not constitute a recommendation to buy or sell any stock, and does not take account of your objectives, or your financial situation. We aim to bring you long-term focused analysis driven by fundamental data. Note that our analysis may not factor in the latest price-sensitive company announcements or qualitative material. Simply Wall St has no position in any stocks mentioned.
About SZSE:300736
Flawless balance sheet minimal.
