- China
- /
- Specialty Stores
- /
- SZSE:300736
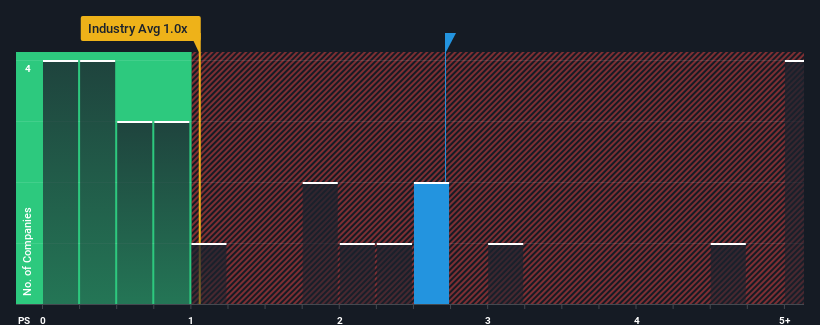
BYBON Group Company Limited's (SZSE:300736) Shareholders Might Be Looking For Exit


BYBON Group Company Limited's (SZSE:300736) price-to-sales (or "P/S") ratio of 2.7x may not look like an appealing investment opportunity when you consider close to half the companies in the Specialty Retail industry in China have P/S ratios below 1x. However, the P/S might be high for a reason and it requires further investigation to determine if it's justified.
Check out our latest analysis for BYBON Group
How BYBON Group Has Been Performing
Recent times have been quite advantageous for BYBON Group as its revenue has been rising very briskly. Perhaps the market is expecting future revenue performance to outperform the wider market, which has seemingly got people interested in the stock. If not, then existing shareholders might be a little nervous about the viability of the share price.
Although there are no analyst estimates available for BYBON Group, take a look at this free data-rich visualisation to see how the company stacks up on earnings, revenue and cash flow.Is There Enough Revenue Growth Forecasted For BYBON Group?
In order to justify its P/S ratio, BYBON Group would need to produce impressive growth in excess of the industry.
Taking a look back first, we see that the company grew revenue by an impressive 147% last year. As a result, it also grew revenue by 28% in total over the last three years. So we can start by confirming that the company has actually done a good job of growing revenue over that time.
Comparing that to the industry, which is predicted to deliver 22% growth in the next 12 months, the company's momentum is weaker, based on recent medium-term annualised revenue results.
With this in mind, we find it worrying that BYBON Group's P/S exceeds that of its industry peers. It seems most investors are ignoring the fairly limited recent growth rates and are hoping for a turnaround in the company's business prospects. Only the boldest would assume these prices are sustainable as a continuation of recent revenue trends is likely to weigh heavily on the share price eventually.
The Key Takeaway
Typically, we'd caution against reading too much into price-to-sales ratios when settling on investment decisions, though it can reveal plenty about what other market participants think about the company.
Our examination of BYBON Group revealed its poor three-year revenue trends aren't detracting from the P/S as much as we though, given they look worse than current industry expectations. When we see slower than industry revenue growth but an elevated P/S, there's considerable risk of the share price declining, sending the P/S lower. Unless the recent medium-term conditions improve markedly, it's very challenging to accept these the share price as being reasonable.
It is also worth noting that we have found 1 warning sign for BYBON Group that you need to take into consideration.
If strong companies turning a profit tickle your fancy, then you'll want to check out this free list of interesting companies that trade on a low P/E (but have proven they can grow earnings).
Valuation is complex, but we're here to simplify it.
Discover if BYBON Group might be undervalued or overvalued with our detailed analysis, featuring fair value estimates, potential risks, dividends, insider trades, and its financial condition.
Access Free AnalysisHave feedback on this article? Concerned about the content? Get in touch with us directly. Alternatively, email editorial-team (at) simplywallst.com.
This article by Simply Wall St is general in nature. We provide commentary based on historical data and analyst forecasts only using an unbiased methodology and our articles are not intended to be financial advice. It does not constitute a recommendation to buy or sell any stock, and does not take account of your objectives, or your financial situation. We aim to bring you long-term focused analysis driven by fundamental data. Note that our analysis may not factor in the latest price-sensitive company announcements or qualitative material. Simply Wall St has no position in any stocks mentioned.
About SZSE:300736
Flawless balance sheet with weak fundamentals.
Market Insights

Community Narratives


