- China
- /
- General Merchandise and Department Stores
- /
- SHSE:600785
Subdued Growth No Barrier To Yinchuan Xinhua Commercial (Group) Co., Ltd. (SHSE:600785) With Shares Advancing 31%


Yinchuan Xinhua Commercial (Group) Co., Ltd. (SHSE:600785) shareholders have had their patience rewarded with a 31% share price jump in the last month. Notwithstanding the latest gain, the annual share price return of 2.3% isn't as impressive.
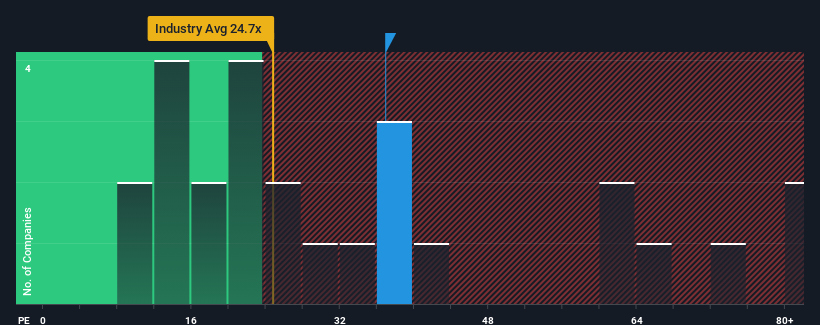
Following the firm bounce in price, Yinchuan Xinhua Commercial (Group)'s price-to-earnings (or "P/E") ratio of 36.9x might make it look like a sell right now compared to the market in China, where around half of the companies have P/E ratios below 29x and even P/E's below 18x are quite common. However, the P/E might be high for a reason and it requires further investigation to determine if it's justified.
Yinchuan Xinhua Commercial (Group) has been struggling lately as its earnings have declined faster than most other companies. One possibility is that the P/E is high because investors think the company will turn things around completely and accelerate past most others in the market. You'd really hope so, otherwise you're paying a pretty hefty price for no particular reason.
Check out our latest analysis for Yinchuan Xinhua Commercial (Group)
What Are Growth Metrics Telling Us About The High P/E?
Yinchuan Xinhua Commercial (Group)'s P/E ratio would be typical for a company that's expected to deliver solid growth, and importantly, perform better than the market.
If we review the last year of earnings, dishearteningly the company's profits fell to the tune of 28%. Still, the latest three year period has seen an excellent 143% overall rise in EPS, in spite of its unsatisfying short-term performance. So we can start by confirming that the company has generally done a very good job of growing earnings over that time, even though it had some hiccups along the way.
Shifting to the future, estimates from the one analyst covering the company suggest earnings should grow by 21% over the next year. That's shaping up to be materially lower than the 41% growth forecast for the broader market.
In light of this, it's alarming that Yinchuan Xinhua Commercial (Group)'s P/E sits above the majority of other companies. It seems most investors are hoping for a turnaround in the company's business prospects, but the analyst cohort is not so confident this will happen. There's a good chance these shareholders are setting themselves up for future disappointment if the P/E falls to levels more in line with the growth outlook.
What We Can Learn From Yinchuan Xinhua Commercial (Group)'s P/E?
The large bounce in Yinchuan Xinhua Commercial (Group)'s shares has lifted the company's P/E to a fairly high level. We'd say the price-to-earnings ratio's power isn't primarily as a valuation instrument but rather to gauge current investor sentiment and future expectations.
We've established that Yinchuan Xinhua Commercial (Group) currently trades on a much higher than expected P/E since its forecast growth is lower than the wider market. Right now we are increasingly uncomfortable with the high P/E as the predicted future earnings aren't likely to support such positive sentiment for long. Unless these conditions improve markedly, it's very challenging to accept these prices as being reasonable.
A lot of potential risks can sit within a company's balance sheet. Take a look at our free balance sheet analysis for Yinchuan Xinhua Commercial (Group) with six simple checks on some of these key factors.
Of course, you might also be able to find a better stock than Yinchuan Xinhua Commercial (Group). So you may wish to see this free collection of other companies that have reasonable P/E ratios and have grown earnings strongly.
New: Manage All Your Stock Portfolios in One Place
We've created the ultimate portfolio companion for stock investors, and it's free.
• Connect an unlimited number of Portfolios and see your total in one currency
• Be alerted to new Warning Signs or Risks via email or mobile
• Track the Fair Value of your stocks
Have feedback on this article? Concerned about the content? Get in touch with us directly. Alternatively, email editorial-team (at) simplywallst.com.
This article by Simply Wall St is general in nature. We provide commentary based on historical data and analyst forecasts only using an unbiased methodology and our articles are not intended to be financial advice. It does not constitute a recommendation to buy or sell any stock, and does not take account of your objectives, or your financial situation. We aim to bring you long-term focused analysis driven by fundamental data. Note that our analysis may not factor in the latest price-sensitive company announcements or qualitative material. Simply Wall St has no position in any stocks mentioned.
About SHSE:600785
Yinchuan Xinhua Commercial (Group)
Yinchuan Xinhua Commercial (Group) Co., Ltd.
Good value with mediocre balance sheet.
Market Insights

Community Narratives


