
Advertisement
- China
- /
- Retail Distributors
- /
- SHSE:600250
Nanjing Business & Tourism Corp.,Ltd.'s (SHSE:600250) 25% Cheaper Price Remains In Tune With Earnings

Nanjing Business & Tourism Corp.,Ltd. (SHSE:600250) shares have retraced a considerable 25% in the last month, reversing a fair amount of their solid recent performance. Still, a bad month hasn't completely ruined the past year with the stock gaining 44%, which is great even in a bull market.
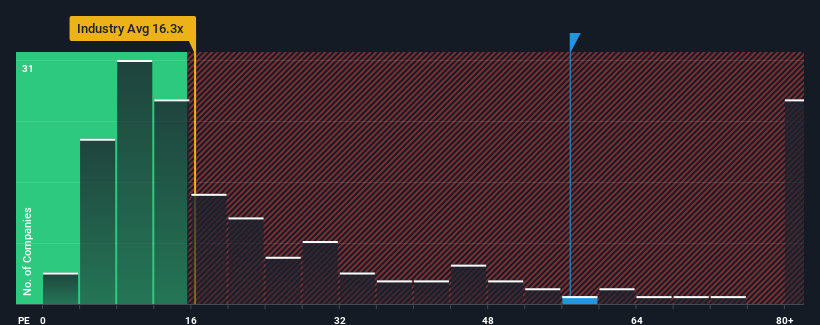
Even after such a large drop in price, Nanjing Business & TourismLtd's price-to-earnings (or "P/E") ratio of 56.8x might still make it look like a strong sell right now compared to the market in China, where around half of the companies have P/E ratios below 32x and even P/E's below 20x are quite common. Nonetheless, we'd need to dig a little deeper to determine if there is a rational basis for the highly elevated P/E.
As an illustration, earnings have deteriorated at Nanjing Business & TourismLtd over the last year, which is not ideal at all. It might be that many expect the company to still outplay most other companies over the coming period, which has kept the P/E from collapsing. If not, then existing shareholders may be quite nervous about the viability of the share price.
See our latest analysis for Nanjing Business & TourismLtd
Is There Enough Growth For Nanjing Business & TourismLtd?
The only time you'd be truly comfortable seeing a P/E as steep as Nanjing Business & TourismLtd's is when the company's growth is on track to outshine the market decidedly.
Retrospectively, the last year delivered a frustrating 47% decrease to the company's bottom line. However, a few very strong years before that means that it was still able to grow EPS by an impressive 2,773% in total over the last three years. Although it's been a bumpy ride, it's still fair to say the earnings growth recently has been more than adequate for the company.
Weighing that recent medium-term earnings trajectory against the broader market's one-year forecast for expansion of 38% shows it's noticeably more attractive on an annualised basis.
In light of this, it's understandable that Nanjing Business & TourismLtd's P/E sits above the majority of other companies. It seems most investors are expecting this strong growth to continue and are willing to pay more for the stock.
The Bottom Line On Nanjing Business & TourismLtd's P/E
A significant share price dive has done very little to deflate Nanjing Business & TourismLtd's very lofty P/E. We'd say the price-to-earnings ratio's power isn't primarily as a valuation instrument but rather to gauge current investor sentiment and future expectations.
We've established that Nanjing Business & TourismLtd maintains its high P/E on the strength of its recent three-year growth being higher than the wider market forecast, as expected. Right now shareholders are comfortable with the P/E as they are quite confident earnings aren't under threat. If recent medium-term earnings trends continue, it's hard to see the share price falling strongly in the near future under these circumstances.
And what about other risks? Every company has them, and we've spotted 3 warning signs for Nanjing Business & TourismLtd (of which 1 shouldn't be ignored!) you should know about.
If P/E ratios interest you, you may wish to see this free collection of other companies with strong earnings growth and low P/E ratios.
Valuation is complex, but we're here to simplify it.
Discover if Nanjing Business & TourismLtd might be undervalued or overvalued with our detailed analysis, featuring fair value estimates, potential risks, dividends, insider trades, and its financial condition.
Access Free AnalysisHave feedback on this article? Concerned about the content? Get in touch with us directly. Alternatively, email editorial-team (at) simplywallst.com.
This article by Simply Wall St is general in nature. We provide commentary based on historical data and analyst forecasts only using an unbiased methodology and our articles are not intended to be financial advice. It does not constitute a recommendation to buy or sell any stock, and does not take account of your objectives, or your financial situation. We aim to bring you long-term focused analysis driven by fundamental data. Note that our analysis may not factor in the latest price-sensitive company announcements or qualitative material. Simply Wall St has no position in any stocks mentioned.
About SHSE:600250
Nanjing Business & TourismLtd
Imports and exports textiles and garments worldwide.
Adequate balance sheet with questionable track record.
Market Insights

Advertisement
Community Narratives

Apple: A Dying Star with an Overpriced Valuation
Fair Value US$177.34|19.1% overvalued
IN
Community Contributor
Avino a case for USD$20 per share within 5 years (assuming $3,500 gold, $100 silver and $4 copper).
Fair Value CA$26.79|86.0% undervalued
AG
Community Contributor
Riding the Defense Boom RENK Sees Revenue Climb at 15% CAGR by FY 2029
Fair Value €69.87|14.3% undervalued
CH
Community Contributor