- China
- /
- Real Estate
- /
- SHSE:600743
The Market Lifts Huayuan Property Co.,Ltd. (SHSE:600743) Shares 33% But It Can Do More


Huayuan Property Co.,Ltd. (SHSE:600743) shareholders would be excited to see that the share price has had a great month, posting a 33% gain and recovering from prior weakness. The bad news is that even after the stocks recovery in the last 30 days, shareholders are still underwater by about 5.7% over the last year.
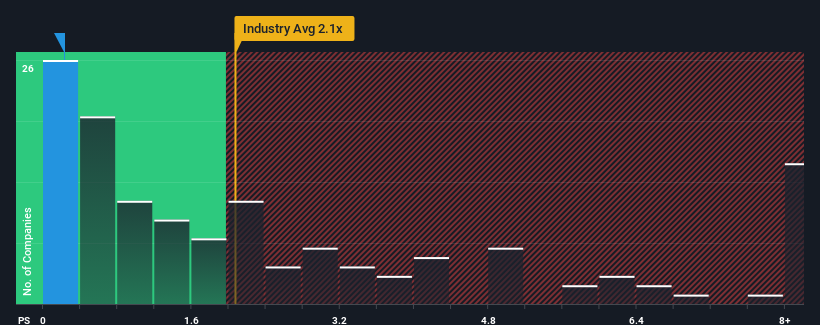
Even after such a large jump in price, Huayuan PropertyLtd may still be sending buy signals at present with its price-to-sales (or "P/S") ratio of 0.2x, considering almost half of all companies in the Real Estate industry in China have P/S ratios greater than 2.1x and even P/S higher than 5x aren't out of the ordinary. However, the P/S might be low for a reason and it requires further investigation to determine if it's justified.
See our latest analysis for Huayuan PropertyLtd
How Huayuan PropertyLtd Has Been Performing
Huayuan PropertyLtd certainly has been doing a great job lately as it's been growing its revenue at a really rapid pace. One possibility is that the P/S ratio is low because investors think this strong revenue growth might actually underperform the broader industry in the near future. Those who are bullish on Huayuan PropertyLtd will be hoping that this isn't the case, so that they can pick up the stock at a lower valuation.
We don't have analyst forecasts, but you can see how recent trends are setting up the company for the future by checking out our free report on Huayuan PropertyLtd's earnings, revenue and cash flow.Do Revenue Forecasts Match The Low P/S Ratio?
Huayuan PropertyLtd's P/S ratio would be typical for a company that's only expected to deliver limited growth, and importantly, perform worse than the industry.
Taking a look back first, we see that the company grew revenue by an impressive 36% last year. The strong recent performance means it was also able to grow revenue by 74% in total over the last three years. So we can start by confirming that the company has done a great job of growing revenue over that time.
Comparing that recent medium-term revenue trajectory with the industry's one-year growth forecast of 5.5% shows it's noticeably more attractive.
In light of this, it's peculiar that Huayuan PropertyLtd's P/S sits below the majority of other companies. It looks like most investors are not convinced the company can maintain its recent growth rates.
The Final Word
The latest share price surge wasn't enough to lift Huayuan PropertyLtd's P/S close to the industry median. Typically, we'd caution against reading too much into price-to-sales ratios when settling on investment decisions, though it can reveal plenty about what other market participants think about the company.
Our examination of Huayuan PropertyLtd revealed its three-year revenue trends aren't boosting its P/S anywhere near as much as we would have predicted, given they look better than current industry expectations. When we see strong revenue with faster-than-industry growth, we assume there are some significant underlying risks to the company's ability to make money which is applying downwards pressure on the P/S ratio. While recent revenue trends over the past medium-term suggest that the risk of a price decline is low, investors appear to perceive a likelihood of revenue fluctuations in the future.
It's always necessary to consider the ever-present spectre of investment risk. We've identified 2 warning signs with Huayuan PropertyLtd, and understanding these should be part of your investment process.
If you're unsure about the strength of Huayuan PropertyLtd's business, why not explore our interactive list of stocks with solid business fundamentals for some other companies you may have missed.
If you're looking to trade Huayuan PropertyLtd, open an account with the lowest-cost platform trusted by professionals, Interactive Brokers.
With clients in over 200 countries and territories, and access to 160 markets, IBKR lets you trade stocks, options, futures, forex, bonds and funds from a single integrated account.
Enjoy no hidden fees, no account minimums, and FX conversion rates as low as 0.03%, far better than what most brokers offer.
Sponsored ContentValuation is complex, but we're here to simplify it.
Discover if Huayuan PropertyLtd might be undervalued or overvalued with our detailed analysis, featuring fair value estimates, potential risks, dividends, insider trades, and its financial condition.
Access Free AnalysisHave feedback on this article? Concerned about the content? Get in touch with us directly. Alternatively, email editorial-team (at) simplywallst.com.
This article by Simply Wall St is general in nature. We provide commentary based on historical data and analyst forecasts only using an unbiased methodology and our articles are not intended to be financial advice. It does not constitute a recommendation to buy or sell any stock, and does not take account of your objectives, or your financial situation. We aim to bring you long-term focused analysis driven by fundamental data. Note that our analysis may not factor in the latest price-sensitive company announcements or qualitative material. Simply Wall St has no position in any stocks mentioned.
About SHSE:600743
Huayuan PropertyLtd
Engages in the development, sale, management, and leasing of real estate properties in China.
Slightly overvalued with imperfect balance sheet.
Market Insights

Community Narratives


