- China
- /
- Real Estate
- /
- SHSE:600048
Here's Why Poly Developments and Holdings Group (SHSE:600048) Is Weighed Down By Its Debt Load


Legendary fund manager Li Lu (who Charlie Munger backed) once said, 'The biggest investment risk is not the volatility of prices, but whether you will suffer a permanent loss of capital.' So it seems the smart money knows that debt - which is usually involved in bankruptcies - is a very important factor, when you assess how risky a company is. Importantly, Poly Developments and Holdings Group Co., Ltd. (SHSE:600048) does carry debt. But the more important question is: how much risk is that debt creating?
What Risk Does Debt Bring?
Debt assists a business until the business has trouble paying it off, either with new capital or with free cash flow. Ultimately, if the company can't fulfill its legal obligations to repay debt, shareholders could walk away with nothing. However, a more common (but still painful) scenario is that it has to raise new equity capital at a low price, thus permanently diluting shareholders. Of course, the upside of debt is that it often represents cheap capital, especially when it replaces dilution in a company with the ability to reinvest at high rates of return. The first step when considering a company's debt levels is to consider its cash and debt together.
See our latest analysis for Poly Developments and Holdings Group
What Is Poly Developments and Holdings Group's Net Debt?
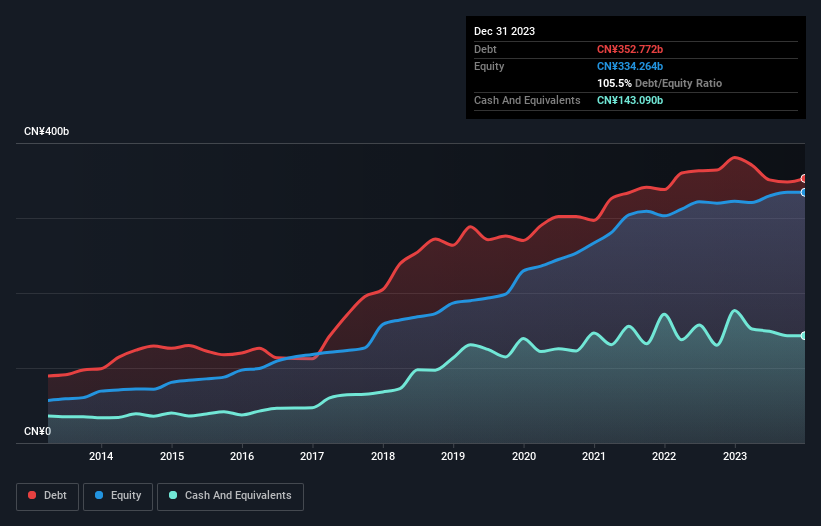
You can click the graphic below for the historical numbers, but it shows that Poly Developments and Holdings Group had CN¥352.8b of debt in September 2023, down from CN¥380.8b, one year before. However, it also had CN¥143.1b in cash, and so its net debt is CN¥209.7b.
How Healthy Is Poly Developments and Holdings Group's Balance Sheet?
Zooming in on the latest balance sheet data, we can see that Poly Developments and Holdings Group had liabilities of CN¥818.2b due within 12 months and liabilities of CN¥285.8b due beyond that. Offsetting this, it had CN¥143.1b in cash and CN¥162.9b in receivables that were due within 12 months. So its liabilities outweigh the sum of its cash and (near-term) receivables by CN¥797.9b.
This deficit casts a shadow over the CN¥116.4b company, like a colossus towering over mere mortals. So we definitely think shareholders need to watch this one closely. At the end of the day, Poly Developments and Holdings Group would probably need a major re-capitalization if its creditors were to demand repayment.
We use two main ratios to inform us about debt levels relative to earnings. The first is net debt divided by earnings before interest, tax, depreciation, and amortization (EBITDA), while the second is how many times its earnings before interest and tax (EBIT) covers its interest expense (or its interest cover, for short). Thus we consider debt relative to earnings both with and without depreciation and amortization expenses.
Strangely Poly Developments and Holdings Group has a sky high EBITDA ratio of 8.1, implying high debt, but a strong interest coverage of 164. So either it has access to very cheap long term debt or that interest expense is going to grow! Importantly, Poly Developments and Holdings Group's EBIT fell a jaw-dropping 29% in the last twelve months. If that decline continues then paying off debt will be harder than selling foie gras at a vegan convention. When analysing debt levels, the balance sheet is the obvious place to start. But ultimately the future profitability of the business will decide if Poly Developments and Holdings Group can strengthen its balance sheet over time. So if you want to see what the professionals think, you might find this free report on analyst profit forecasts to be interesting.
Finally, while the tax-man may adore accounting profits, lenders only accept cold hard cash. So the logical step is to look at the proportion of that EBIT that is matched by actual free cash flow. During the last three years, Poly Developments and Holdings Group produced sturdy free cash flow equating to 59% of its EBIT, about what we'd expect. This cold hard cash means it can reduce its debt when it wants to.
Our View
To be frank both Poly Developments and Holdings Group's EBIT growth rate and its track record of staying on top of its total liabilities make us rather uncomfortable with its debt levels. But at least it's pretty decent at covering its interest expense with its EBIT; that's encouraging. Overall, it seems to us that Poly Developments and Holdings Group's balance sheet is really quite a risk to the business. For this reason we're pretty cautious about the stock, and we think shareholders should keep a close eye on its liquidity. When analysing debt levels, the balance sheet is the obvious place to start. But ultimately, every company can contain risks that exist outside of the balance sheet. Be aware that Poly Developments and Holdings Group is showing 3 warning signs in our investment analysis , and 1 of those makes us a bit uncomfortable...
If, after all that, you're more interested in a fast growing company with a rock-solid balance sheet, then check out our list of net cash growth stocks without delay.
New: Manage All Your Stock Portfolios in One Place
We've created the ultimate portfolio companion for stock investors, and it's free.
• Connect an unlimited number of Portfolios and see your total in one currency
• Be alerted to new Warning Signs or Risks via email or mobile
• Track the Fair Value of your stocks
Have feedback on this article? Concerned about the content? Get in touch with us directly. Alternatively, email editorial-team (at) simplywallst.com.
This article by Simply Wall St is general in nature. We provide commentary based on historical data and analyst forecasts only using an unbiased methodology and our articles are not intended to be financial advice. It does not constitute a recommendation to buy or sell any stock, and does not take account of your objectives, or your financial situation. We aim to bring you long-term focused analysis driven by fundamental data. Note that our analysis may not factor in the latest price-sensitive company announcements or qualitative material. Simply Wall St has no position in any stocks mentioned.
About SHSE:600048
Poly Developments and Holdings Group
Poly Developments and Holdings Group Co., Ltd.
Undervalued with adequate balance sheet and pays a dividend.
Similar Companies
Market Insights

Community Narratives
