
Advertisement
Estimating The Fair Value Of CSPC Innovation Pharmaceutical Co., Ltd. (SZSE:300765)

Key Insights
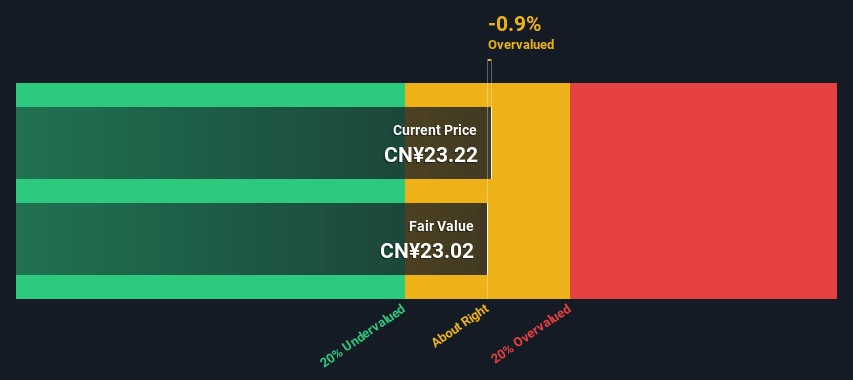
- Using the 2 Stage Free Cash Flow to Equity, CSPC Innovation Pharmaceutical fair value estimate is CN¥23.02
- With CN¥23.22 share price, CSPC Innovation Pharmaceutical appears to be trading close to its estimated fair value
- Analyst price target for 300765 is CN¥38.32, which is 66% above our fair value estimate
Today we'll do a simple run through of a valuation method used to estimate the attractiveness of CSPC Innovation Pharmaceutical Co., Ltd. (SZSE:300765) as an investment opportunity by estimating the company's future cash flows and discounting them to their present value. The Discounted Cash Flow (DCF) model is the tool we will apply to do this. There's really not all that much to it, even though it might appear quite complex.
Companies can be valued in a lot of ways, so we would point out that a DCF is not perfect for every situation. Anyone interested in learning a bit more about intrinsic value should have a read of the Simply Wall St analysis model.
Check out our latest analysis for CSPC Innovation Pharmaceutical
Crunching The Numbers
We are going to use a two-stage DCF model, which, as the name states, takes into account two stages of growth. The first stage is generally a higher growth period which levels off heading towards the terminal value, captured in the second 'steady growth' period. To start off with, we need to estimate the next ten years of cash flows. Where possible we use analyst estimates, but when these aren't available we extrapolate the previous free cash flow (FCF) from the last estimate or reported value. We assume companies with shrinking free cash flow will slow their rate of shrinkage, and that companies with growing free cash flow will see their growth rate slow, over this period. We do this to reflect that growth tends to slow more in the early years than it does in later years.
A DCF is all about the idea that a dollar in the future is less valuable than a dollar today, so we discount the value of these future cash flows to their estimated value in today's dollars:
10-year free cash flow (FCF) estimate
| 2025 | 2026 | 2027 | 2028 | 2029 | 2030 | 2031 | 2032 | 2033 | 2034 | |
| Levered FCF (CN¥, Millions) | CN¥932.8m | CN¥1.55b | CN¥1.87b | CN¥1.71b | CN¥1.62b | CN¥1.58b | CN¥1.56b | CN¥1.57b | CN¥1.58b | CN¥1.61b |
| Growth Rate Estimate Source | Analyst x2 | Analyst x2 | Analyst x2 | Analyst x1 | Est @ -4.96% | Est @ -2.62% | Est @ -0.98% | Est @ 0.17% | Est @ 0.97% | Est @ 1.54% |
| Present Value (CN¥, Millions) Discounted @ 6.8% | CN¥873 | CN¥1.4k | CN¥1.5k | CN¥1.3k | CN¥1.2k | CN¥1.1k | CN¥985 | CN¥924 | CN¥873 | CN¥830 |
("Est" = FCF growth rate estimated by Simply Wall St)
Present Value of 10-year Cash Flow (PVCF) = CN¥11b
We now need to calculate the Terminal Value, which accounts for all the future cash flows after this ten year period. The Gordon Growth formula is used to calculate Terminal Value at a future annual growth rate equal to the 5-year average of the 10-year government bond yield of 2.9%. We discount the terminal cash flows to today's value at a cost of equity of 6.8%.
Terminal Value (TV)= FCF2034 × (1 + g) ÷ (r – g) = CN¥1.6b× (1 + 2.9%) ÷ (6.8%– 2.9%) = CN¥41b
Present Value of Terminal Value (PVTV)= TV / (1 + r)10= CN¥41b÷ ( 1 + 6.8%)10= CN¥21b
The total value, or equity value, is then the sum of the present value of the future cash flows, which in this case is CN¥32b. In the final step we divide the equity value by the number of shares outstanding. Relative to the current share price of CN¥23.2, the company appears around fair value at the time of writing. Valuations are imprecise instruments though, rather like a telescope - move a few degrees and end up in a different galaxy. Do keep this in mind.
The Assumptions
The calculation above is very dependent on two assumptions. The first is the discount rate and the other is the cash flows. Part of investing is coming up with your own evaluation of a company's future performance, so try the calculation yourself and check your own assumptions. The DCF also does not consider the possible cyclicality of an industry, or a company's future capital requirements, so it does not give a full picture of a company's potential performance. Given that we are looking at CSPC Innovation Pharmaceutical as potential shareholders, the cost of equity is used as the discount rate, rather than the cost of capital (or weighted average cost of capital, WACC) which accounts for debt. In this calculation we've used 6.8%, which is based on a levered beta of 0.800. Beta is a measure of a stock's volatility, compared to the market as a whole. We get our beta from the industry average beta of globally comparable companies, with an imposed limit between 0.8 and 2.0, which is a reasonable range for a stable business.
SWOT Analysis for CSPC Innovation Pharmaceutical
Strength
- Currently debt free.
Weakness
- Earnings declined over the past year.
- Dividend is low compared to the top 25% of dividend payers in the Pharmaceuticals market.
- Expensive based on P/E ratio and estimated fair value.
Opportunity
- Annual earnings are forecast to grow faster than the Chinese market.
Threat
- Paying a dividend but company has no free cash flows.
Next Steps:
Valuation is only one side of the coin in terms of building your investment thesis, and it is only one of many factors that you need to assess for a company. DCF models are not the be-all and end-all of investment valuation. Rather it should be seen as a guide to "what assumptions need to be true for this stock to be under/overvalued?" For instance, if the terminal value growth rate is adjusted slightly, it can dramatically alter the overall result. For CSPC Innovation Pharmaceutical, we've compiled three relevant elements you should further research:
- Risks: For example, we've discovered 2 warning signs for CSPC Innovation Pharmaceutical (1 is a bit unpleasant!) that you should be aware of before investing here.
- Future Earnings: How does 300765's growth rate compare to its peers and the wider market? Dig deeper into the analyst consensus number for the upcoming years by interacting with our free analyst growth expectation chart.
- Other High Quality Alternatives: Do you like a good all-rounder? Explore our interactive list of high quality stocks to get an idea of what else is out there you may be missing!
PS. Simply Wall St updates its DCF calculation for every Chinese stock every day, so if you want to find the intrinsic value of any other stock just search here.
New: AI Stock Screener & Alerts
Our new AI Stock Screener scans the market every day to uncover opportunities.
• Dividend Powerhouses (3%+ Yield)
• Undervalued Small Caps with Insider Buying
• High growth Tech and AI Companies
Or build your own from over 50 metrics.
Have feedback on this article? Concerned about the content? Get in touch with us directly. Alternatively, email editorial-team (at) simplywallst.com.
This article by Simply Wall St is general in nature. We provide commentary based on historical data and analyst forecasts only using an unbiased methodology and our articles are not intended to be financial advice. It does not constitute a recommendation to buy or sell any stock, and does not take account of your objectives, or your financial situation. We aim to bring you long-term focused analysis driven by fundamental data. Note that our analysis may not factor in the latest price-sensitive company announcements or qualitative material. Simply Wall St has no position in any stocks mentioned.
About SZSE:300765
CSPC Innovation Pharmaceutical
Engages in the research and development, production, and sales of biopharmaceuticals, APIs, and functional foods in China and internationally.
High growth potential with mediocre balance sheet.
Market Insights


Advertisement
Community Narratives
Nike's Direct-to-Consumer Focus Will Drive Future Growth
Fair Value US$87.90|18.2% undervalued
UN
Community Contributor
Novo Nordisk will dominate GLP-1 market with Ozempic and Wegovy growth
Fair Value US$89.59|12.1% undervalued
BE
Community Contributor
Rheinmetall could get 20-25% of EU-NATO 3%-GDP defence spending
Fair Value €7.57k|82.4% undervalued
NO
Community Contributor