
Advertisement
Porton Pharma Solutions Ltd.'s (SZSE:300363) 39% Price Boost Is Out Of Tune With Revenues

Porton Pharma Solutions Ltd. (SZSE:300363) shareholders have had their patience rewarded with a 39% share price jump in the last month. Unfortunately, the gains of the last month did little to right the losses of the last year with the stock still down 41% over that time.
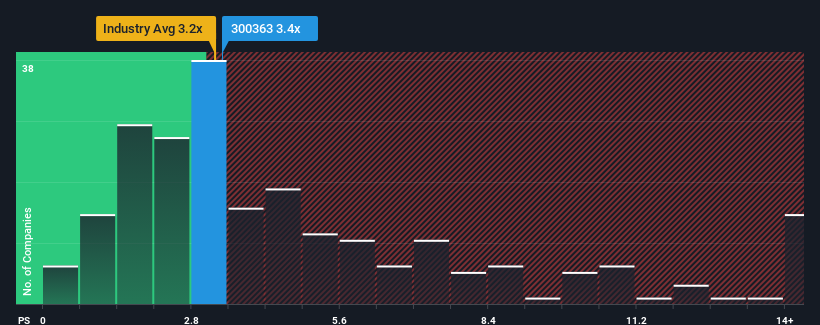
Even after such a large jump in price, it's still not a stretch to say that Porton Pharma Solutions' price-to-sales (or "P/S") ratio of 3.4x right now seems quite "middle-of-the-road" compared to the Pharmaceuticals industry in China, where the median P/S ratio is around 3.2x. However, investors might be overlooking a clear opportunity or potential setback if there is no rational basis for the P/S.
View our latest analysis for Porton Pharma Solutions
What Does Porton Pharma Solutions' P/S Mean For Shareholders?
Porton Pharma Solutions could be doing better as its revenue has been going backwards lately while most other companies have been seeing positive revenue growth. One possibility is that the P/S ratio is moderate because investors think this poor revenue performance will turn around. You'd really hope so, otherwise you're paying a relatively elevated price for a company with this sort of growth profile.
If you'd like to see what analysts are forecasting going forward, you should check out our free report on Porton Pharma Solutions.How Is Porton Pharma Solutions' Revenue Growth Trending?
There's an inherent assumption that a company should be matching the industry for P/S ratios like Porton Pharma Solutions' to be considered reasonable.
In reviewing the last year of financials, we were disheartened to see the company's revenues fell to the tune of 51%. That put a dampener on the good run it was having over the longer-term as its three-year revenue growth is still a noteworthy 12% in total. Although it's been a bumpy ride, it's still fair to say the revenue growth recently has been mostly respectable for the company.
Turning to the outlook, the next year should generate growth of 30% as estimated by the four analysts watching the company. With the industry predicted to deliver 134% growth, the company is positioned for a weaker revenue result.
In light of this, it's curious that Porton Pharma Solutions' P/S sits in line with the majority of other companies. It seems most investors are ignoring the fairly limited growth expectations and are willing to pay up for exposure to the stock. These shareholders may be setting themselves up for future disappointment if the P/S falls to levels more in line with the growth outlook.
What We Can Learn From Porton Pharma Solutions' P/S?
Its shares have lifted substantially and now Porton Pharma Solutions' P/S is back within range of the industry median. It's argued the price-to-sales ratio is an inferior measure of value within certain industries, but it can be a powerful business sentiment indicator.
When you consider that Porton Pharma Solutions' revenue growth estimates are fairly muted compared to the broader industry, it's easy to see why we consider it unexpected to be trading at its current P/S ratio. When we see companies with a relatively weaker revenue outlook compared to the industry, we suspect the share price is at risk of declining, sending the moderate P/S lower. This places shareholders' investments at risk and potential investors in danger of paying an unnecessary premium.
And what about other risks? Every company has them, and we've spotted 2 warning signs for Porton Pharma Solutions (of which 1 makes us a bit uncomfortable!) you should know about.
If strong companies turning a profit tickle your fancy, then you'll want to check out this free list of interesting companies that trade on a low P/E (but have proven they can grow earnings).
New: Manage All Your Stock Portfolios in One Place
We've created the ultimate portfolio companion for stock investors, and it's free.
• Connect an unlimited number of Portfolios and see your total in one currency
• Be alerted to new Warning Signs or Risks via email or mobile
• Track the Fair Value of your stocks
Have feedback on this article? Concerned about the content? Get in touch with us directly. Alternatively, email editorial-team (at) simplywallst.com.
This article by Simply Wall St is general in nature. We provide commentary based on historical data and analyst forecasts only using an unbiased methodology and our articles are not intended to be financial advice. It does not constitute a recommendation to buy or sell any stock, and does not take account of your objectives, or your financial situation. We aim to bring you long-term focused analysis driven by fundamental data. Note that our analysis may not factor in the latest price-sensitive company announcements or qualitative material. Simply Wall St has no position in any stocks mentioned.
About SZSE:300363
Porton Pharma Solutions
Provides contract development and manufacturing organization (CDMO) solutions for small molecules, tides, biologics, and conjugates from pre-clinical to commercial.
Adequate balance sheet with moderate growth potential.
Market Insights

Advertisement
Community Narratives

Apple: A Dying Star with an Overpriced Valuation
Fair Value US$177.34|19.1% overvalued
IN
Community Contributor
Avino a case for USD$20 per share within 5 years (assuming $3,500 gold, $100 silver and $4 copper).
Fair Value CA$26.79|86.0% undervalued
AG
Community Contributor
Riding the Defense Boom RENK Sees Revenue Climb at 15% CAGR by FY 2029
Fair Value €69.87|14.3% undervalued
CH
Community Contributor