Shanxi Zhendong Pharmaceutical Co.,Ltd (SZSE:300158) Surges 31% Yet Its Low P/S Is No Reason For Excitement


Those holding Shanxi Zhendong Pharmaceutical Co.,Ltd (SZSE:300158) shares would be relieved that the share price has rebounded 31% in the last thirty days, but it needs to keep going to repair the recent damage it has caused to investor portfolios. Not all shareholders will be feeling jubilant, since the share price is still down a very disappointing 29% in the last twelve months.
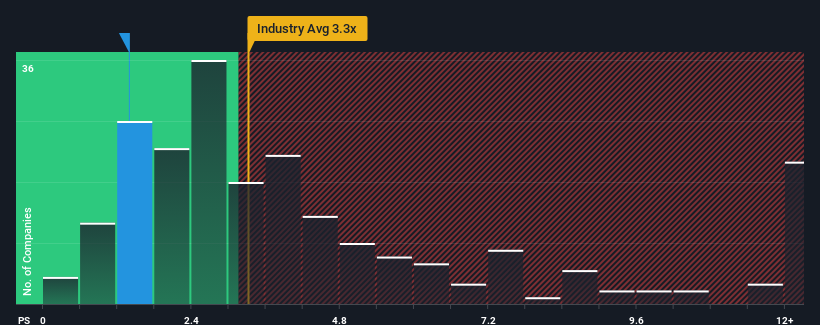
Even after such a large jump in price, Shanxi Zhendong PharmaceuticalLtd may still be sending buy signals at present with its price-to-sales (or "P/S") ratio of 1.4x, considering almost half of all companies in the Pharmaceuticals industry in China have P/S ratios greater than 3.3x and even P/S higher than 6x aren't out of the ordinary. However, the P/S might be low for a reason and it requires further investigation to determine if it's justified.
View our latest analysis for Shanxi Zhendong PharmaceuticalLtd
How Shanxi Zhendong PharmaceuticalLtd Has Been Performing
For instance, Shanxi Zhendong PharmaceuticalLtd's receding revenue in recent times would have to be some food for thought. It might be that many expect the disappointing revenue performance to continue or accelerate, which has repressed the P/S. However, if this doesn't eventuate then existing shareholders may be feeling optimistic about the future direction of the share price.
Although there are no analyst estimates available for Shanxi Zhendong PharmaceuticalLtd, take a look at this free data-rich visualisation to see how the company stacks up on earnings, revenue and cash flow.Is There Any Revenue Growth Forecasted For Shanxi Zhendong PharmaceuticalLtd?
There's an inherent assumption that a company should underperform the industry for P/S ratios like Shanxi Zhendong PharmaceuticalLtd's to be considered reasonable.
Taking a look back first, the company's revenue growth last year wasn't something to get excited about as it posted a disappointing decline of 3.3%. As a result, revenue from three years ago have also fallen 20% overall. So unfortunately, we have to acknowledge that the company has not done a great job of growing revenue over that time.
Weighing that medium-term revenue trajectory against the broader industry's one-year forecast for expansion of 17% shows it's an unpleasant look.
With this in mind, we understand why Shanxi Zhendong PharmaceuticalLtd's P/S is lower than most of its industry peers. Nonetheless, there's no guarantee the P/S has reached a floor yet with revenue going in reverse. Even just maintaining these prices could be difficult to achieve as recent revenue trends are already weighing down the shares.
The Key Takeaway
Shanxi Zhendong PharmaceuticalLtd's stock price has surged recently, but its but its P/S still remains modest. Using the price-to-sales ratio alone to determine if you should sell your stock isn't sensible, however it can be a practical guide to the company's future prospects.
It's no surprise that Shanxi Zhendong PharmaceuticalLtd maintains its low P/S off the back of its sliding revenue over the medium-term. Right now shareholders are accepting the low P/S as they concede future revenue probably won't provide any pleasant surprises either. Unless the recent medium-term conditions improve, they will continue to form a barrier for the share price around these levels.
The company's balance sheet is another key area for risk analysis. Our free balance sheet analysis for Shanxi Zhendong PharmaceuticalLtd with six simple checks will allow you to discover any risks that could be an issue.
If strong companies turning a profit tickle your fancy, then you'll want to check out this free list of interesting companies that trade on a low P/E (but have proven they can grow earnings).
If you're looking to trade Shanxi Zhendong PharmaceuticalLtd, open an account with the lowest-cost platform trusted by professionals, Interactive Brokers.
With clients in over 200 countries and territories, and access to 160 markets, IBKR lets you trade stocks, options, futures, forex, bonds and funds from a single integrated account.
Enjoy no hidden fees, no account minimums, and FX conversion rates as low as 0.03%, far better than what most brokers offer.
Sponsored ContentNew: Manage All Your Stock Portfolios in One Place
We've created the ultimate portfolio companion for stock investors, and it's free.
• Connect an unlimited number of Portfolios and see your total in one currency
• Be alerted to new Warning Signs or Risks via email or mobile
• Track the Fair Value of your stocks
Have feedback on this article? Concerned about the content? Get in touch with us directly. Alternatively, email editorial-team (at) simplywallst.com.
This article by Simply Wall St is general in nature. We provide commentary based on historical data and analyst forecasts only using an unbiased methodology and our articles are not intended to be financial advice. It does not constitute a recommendation to buy or sell any stock, and does not take account of your objectives, or your financial situation. We aim to bring you long-term focused analysis driven by fundamental data. Note that our analysis may not factor in the latest price-sensitive company announcements or qualitative material. Simply Wall St has no position in any stocks mentioned.
About SZSE:300158
Shanxi Zhendong PharmaceuticalLtd
Engages in the research and development, production, and sales of pharmaceutical drugs in China and internationally.
Adequate balance sheet and slightly overvalued.
Market Insights

Community Narratives


