Guiyang Xintian Pharmaceutical Co.,Ltd.'s (SZSE:002873) 25% Dip Still Leaving Some Shareholders Feeling Restless Over Its P/ERatio


Guiyang Xintian Pharmaceutical Co.,Ltd. (SZSE:002873) shareholders won't be pleased to see that the share price has had a very rough month, dropping 25% and undoing the prior period's positive performance. The drop over the last 30 days has capped off a tough year for shareholders, with the share price down 37% in that time.
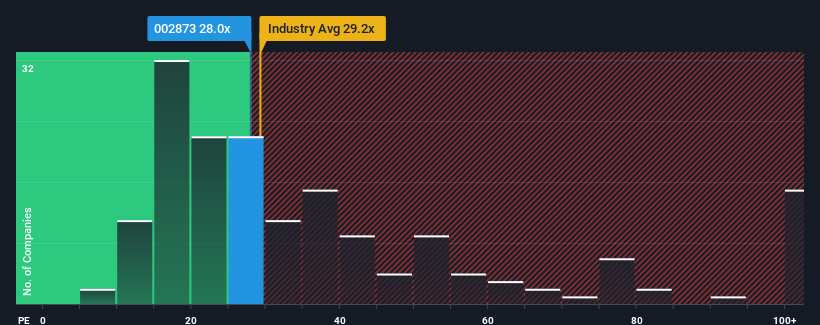
In spite of the heavy fall in price, there still wouldn't be many who think Guiyang Xintian PharmaceuticalLtd's price-to-earnings (or "P/E") ratio of 28x is worth a mention when the median P/E in China is similar at about 31x. While this might not raise any eyebrows, if the P/E ratio is not justified investors could be missing out on a potential opportunity or ignoring looming disappointment.
Guiyang Xintian PharmaceuticalLtd hasn't been tracking well recently as its declining earnings compare poorly to other companies, which have seen some growth on average. It might be that many expect the dour earnings performance to strengthen positively, which has kept the P/E from falling. You'd really hope so, otherwise you're paying a relatively elevated price for a company with this sort of growth profile.
Check out our latest analysis for Guiyang Xintian PharmaceuticalLtd
What Are Growth Metrics Telling Us About The P/E?
There's an inherent assumption that a company should be matching the market for P/E ratios like Guiyang Xintian PharmaceuticalLtd's to be considered reasonable.
If we review the last year of earnings, dishearteningly the company's profits fell to the tune of 32%. As a result, earnings from three years ago have also fallen 24% overall. Therefore, it's fair to say the earnings growth recently has been undesirable for the company.
Turning to the outlook, the next three years should generate growth of 22% each year as estimated by the lone analyst watching the company. Meanwhile, the rest of the market is forecast to expand by 25% each year, which is noticeably more attractive.
In light of this, it's curious that Guiyang Xintian PharmaceuticalLtd's P/E sits in line with the majority of other companies. Apparently many investors in the company are less bearish than analysts indicate and aren't willing to let go of their stock right now. These shareholders may be setting themselves up for future disappointment if the P/E falls to levels more in line with the growth outlook.
The Bottom Line On Guiyang Xintian PharmaceuticalLtd's P/E
With its share price falling into a hole, the P/E for Guiyang Xintian PharmaceuticalLtd looks quite average now. While the price-to-earnings ratio shouldn't be the defining factor in whether you buy a stock or not, it's quite a capable barometer of earnings expectations.
Our examination of Guiyang Xintian PharmaceuticalLtd's analyst forecasts revealed that its inferior earnings outlook isn't impacting its P/E as much as we would have predicted. When we see a weak earnings outlook with slower than market growth, we suspect the share price is at risk of declining, sending the moderate P/E lower. Unless these conditions improve, it's challenging to accept these prices as being reasonable.
You should always think about risks. Case in point, we've spotted 3 warning signs for Guiyang Xintian PharmaceuticalLtd you should be aware of, and 1 of them doesn't sit too well with us.
It's important to make sure you look for a great company, not just the first idea you come across. So take a peek at this free list of interesting companies with strong recent earnings growth (and a low P/E).
If you're looking to trade Guiyang Xintian PharmaceuticalLtd, open an account with the lowest-cost platform trusted by professionals, Interactive Brokers.
With clients in over 200 countries and territories, and access to 160 markets, IBKR lets you trade stocks, options, futures, forex, bonds and funds from a single integrated account.
Enjoy no hidden fees, no account minimums, and FX conversion rates as low as 0.03%, far better than what most brokers offer.
Sponsored ContentNew: Manage All Your Stock Portfolios in One Place
We've created the ultimate portfolio companion for stock investors, and it's free.
• Connect an unlimited number of Portfolios and see your total in one currency
• Be alerted to new Warning Signs or Risks via email or mobile
• Track the Fair Value of your stocks
Have feedback on this article? Concerned about the content? Get in touch with us directly. Alternatively, email editorial-team (at) simplywallst.com.
This article by Simply Wall St is general in nature. We provide commentary based on historical data and analyst forecasts only using an unbiased methodology and our articles are not intended to be financial advice. It does not constitute a recommendation to buy or sell any stock, and does not take account of your objectives, or your financial situation. We aim to bring you long-term focused analysis driven by fundamental data. Note that our analysis may not factor in the latest price-sensitive company announcements or qualitative material. Simply Wall St has no position in any stocks mentioned.
About SZSE:002873
Guiyang Xintian PharmaceuticalLtd
Engages in the research and development, production, and sale of new Chinese patent medicines in China.
Adequate balance sheet second-rate dividend payer.
Market Insights

Community Narratives


