Sichuan Kelun Pharmaceutical (SZSE:002422) jumps 3.3% this week, though earnings growth is still tracking behind three-year shareholder returns


By buying an index fund, investors can approximate the average market return. But many of us dare to dream of bigger returns, and build a portfolio ourselves. For example, the Sichuan Kelun Pharmaceutical Co., Ltd. (SZSE:002422) share price is up 78% in the last three years, clearly besting the market decline of around 11% (not including dividends). However, more recent returns haven't been as impressive as that, with the stock returning just 16% in the last year, including dividends.
The past week has proven to be lucrative for Sichuan Kelun Pharmaceutical investors, so let's see if fundamentals drove the company's three-year performance.
View our latest analysis for Sichuan Kelun Pharmaceutical
To quote Buffett, 'Ships will sail around the world but the Flat Earth Society will flourish. There will continue to be wide discrepancies between price and value in the marketplace...' One way to examine how market sentiment has changed over time is to look at the interaction between a company's share price and its earnings per share (EPS).
Sichuan Kelun Pharmaceutical was able to grow its EPS at 31% per year over three years, sending the share price higher. This EPS growth is higher than the 21% average annual increase in the share price. Therefore, it seems the market has moderated its expectations for growth, somewhat.
The company's earnings per share (over time) is depicted in the image below (click to see the exact numbers).
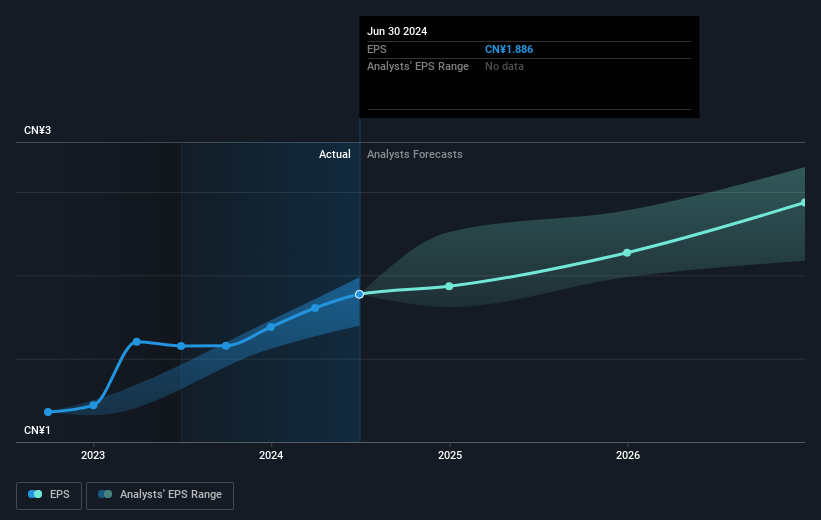
It is of course excellent to see how Sichuan Kelun Pharmaceutical has grown profits over the years, but the future is more important for shareholders. Take a more thorough look at Sichuan Kelun Pharmaceutical's financial health with this free report on its balance sheet.
What About Dividends?
When looking at investment returns, it is important to consider the difference between total shareholder return (TSR) and share price return. Whereas the share price return only reflects the change in the share price, the TSR includes the value of dividends (assuming they were reinvested) and the benefit of any discounted capital raising or spin-off. So for companies that pay a generous dividend, the TSR is often a lot higher than the share price return. We note that for Sichuan Kelun Pharmaceutical the TSR over the last 3 years was 91%, which is better than the share price return mentioned above. And there's no prize for guessing that the dividend payments largely explain the divergence!
A Different Perspective
It's good to see that Sichuan Kelun Pharmaceutical has rewarded shareholders with a total shareholder return of 16% in the last twelve months. That's including the dividend. That gain is better than the annual TSR over five years, which is 8%. Therefore it seems like sentiment around the company has been positive lately. Someone with an optimistic perspective could view the recent improvement in TSR as indicating that the business itself is getting better with time. It's always interesting to track share price performance over the longer term. But to understand Sichuan Kelun Pharmaceutical better, we need to consider many other factors. For instance, we've identified 2 warning signs for Sichuan Kelun Pharmaceutical that you should be aware of.
We will like Sichuan Kelun Pharmaceutical better if we see some big insider buys. While we wait, check out this free list of undervalued stocks (mostly small caps) with considerable, recent, insider buying.
Please note, the market returns quoted in this article reflect the market weighted average returns of stocks that currently trade on Chinese exchanges.
If you're looking to trade Sichuan Kelun Pharmaceutical, open an account with the lowest-cost platform trusted by professionals, Interactive Brokers.
With clients in over 200 countries and territories, and access to 160 markets, IBKR lets you trade stocks, options, futures, forex, bonds and funds from a single integrated account.
Enjoy no hidden fees, no account minimums, and FX conversion rates as low as 0.03%, far better than what most brokers offer.
Sponsored ContentNew: Manage All Your Stock Portfolios in One Place
We've created the ultimate portfolio companion for stock investors, and it's free.
• Connect an unlimited number of Portfolios and see your total in one currency
• Be alerted to new Warning Signs or Risks via email or mobile
• Track the Fair Value of your stocks
Have feedback on this article? Concerned about the content? Get in touch with us directly. Alternatively, email editorial-team (at) simplywallst.com.
This article by Simply Wall St is general in nature. We provide commentary based on historical data and analyst forecasts only using an unbiased methodology and our articles are not intended to be financial advice. It does not constitute a recommendation to buy or sell any stock, and does not take account of your objectives, or your financial situation. We aim to bring you long-term focused analysis driven by fundamental data. Note that our analysis may not factor in the latest price-sensitive company announcements or qualitative material. Simply Wall St has no position in any stocks mentioned.
About SZSE:002422
Sichuan Kelun Pharmaceutical
Researches, develops, manufactures, distributes, and sells pharmaceutical products in China.
Very undervalued with flawless balance sheet and pays a dividend.
Similar Companies
Market Insights

Community Narratives

