Benign Growth For Hubei Guangji Pharmaceutical Co., Ltd. (SZSE:000952) Underpins Stock's 30% Plummet


Hubei Guangji Pharmaceutical Co., Ltd. (SZSE:000952) shareholders won't be pleased to see that the share price has had a very rough month, dropping 30% and undoing the prior period's positive performance. Instead of being rewarded, shareholders who have already held through the last twelve months are now sitting on a 30% share price drop.
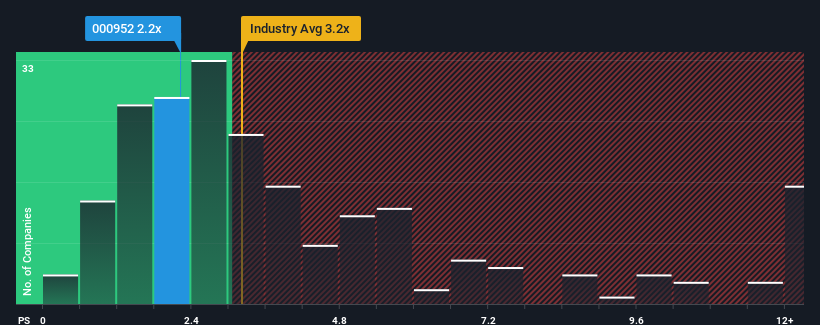
After such a large drop in price, Hubei Guangji Pharmaceutical's price-to-sales (or "P/S") ratio of 2.2x might make it look like a buy right now compared to the Pharmaceuticals industry in China, where around half of the companies have P/S ratios above 3.2x and even P/S above 6x are quite common. However, the P/S might be low for a reason and it requires further investigation to determine if it's justified.
See our latest analysis for Hubei Guangji Pharmaceutical
What Does Hubei Guangji Pharmaceutical's P/S Mean For Shareholders?
The recent revenue growth at Hubei Guangji Pharmaceutical would have to be considered satisfactory if not spectacular. One possibility is that the P/S ratio is low because investors think this good revenue growth might actually underperform the broader industry in the near future. If that doesn't eventuate, then existing shareholders may have reason to be optimistic about the future direction of the share price.
We don't have analyst forecasts, but you can see how recent trends are setting up the company for the future by checking out our free report on Hubei Guangji Pharmaceutical's earnings, revenue and cash flow.How Is Hubei Guangji Pharmaceutical's Revenue Growth Trending?
There's an inherent assumption that a company should underperform the industry for P/S ratios like Hubei Guangji Pharmaceutical's to be considered reasonable.
Taking a look back first, we see that the company managed to grow revenues by a handy 3.0% last year. The solid recent performance means it was also able to grow revenue by 9.8% in total over the last three years. Accordingly, shareholders would have probably been satisfied with the medium-term rates of revenue growth.
This is in contrast to the rest of the industry, which is expected to grow by 18% over the next year, materially higher than the company's recent medium-term annualised growth rates.
With this in consideration, it's easy to understand why Hubei Guangji Pharmaceutical's P/S falls short of the mark set by its industry peers. It seems most investors are expecting to see the recent limited growth rates continue into the future and are only willing to pay a reduced amount for the stock.
The Key Takeaway
Hubei Guangji Pharmaceutical's recently weak share price has pulled its P/S back below other Pharmaceuticals companies. Generally, our preference is to limit the use of the price-to-sales ratio to establishing what the market thinks about the overall health of a company.
As we suspected, our examination of Hubei Guangji Pharmaceutical revealed its three-year revenue trends are contributing to its low P/S, given they look worse than current industry expectations. Right now shareholders are accepting the low P/S as they concede future revenue probably won't provide any pleasant surprises. Unless the recent medium-term conditions improve, they will continue to form a barrier for the share price around these levels.
It's always necessary to consider the ever-present spectre of investment risk. We've identified 3 warning signs with Hubei Guangji Pharmaceutical (at least 2 which are a bit unpleasant), and understanding them should be part of your investment process.
If strong companies turning a profit tickle your fancy, then you'll want to check out this free list of interesting companies that trade on a low P/E (but have proven they can grow earnings).
If you're looking to trade Hubei Guangji Pharmaceutical, open an account with the lowest-cost platform trusted by professionals, Interactive Brokers.
With clients in over 200 countries and territories, and access to 160 markets, IBKR lets you trade stocks, options, futures, forex, bonds and funds from a single integrated account.
Enjoy no hidden fees, no account minimums, and FX conversion rates as low as 0.03%, far better than what most brokers offer.
Sponsored ContentValuation is complex, but we're here to simplify it.
Discover if Hubei Guangji Pharmaceutical might be undervalued or overvalued with our detailed analysis, featuring fair value estimates, potential risks, dividends, insider trades, and its financial condition.
Access Free AnalysisHave feedback on this article? Concerned about the content? Get in touch with us directly. Alternatively, email editorial-team (at) simplywallst.com.
This article by Simply Wall St is general in nature. We provide commentary based on historical data and analyst forecasts only using an unbiased methodology and our articles are not intended to be financial advice. It does not constitute a recommendation to buy or sell any stock, and does not take account of your objectives, or your financial situation. We aim to bring you long-term focused analysis driven by fundamental data. Note that our analysis may not factor in the latest price-sensitive company announcements or qualitative material. Simply Wall St has no position in any stocks mentioned.
About SZSE:000952
Hubei Guangji Pharmaceutical
Manufactures and sells pharmaceutical raw materials, medicinal feed additives, fine chemicals, and preparations in China.
Slightly overvalued very low.
Market Insights

Community Narratives


