
Advertisement
Sichuan Huiyu Pharmaceutical Co., Ltd.'s (SHSE:688553) 33% Share Price Surge Not Quite Adding Up

Those holding Sichuan Huiyu Pharmaceutical Co., Ltd. (SHSE:688553) shares would be relieved that the share price has rebounded 33% in the last thirty days, but it needs to keep going to repair the recent damage it has caused to investor portfolios. Unfortunately, the gains of the last month did little to right the losses of the last year with the stock still down 24% over that time.
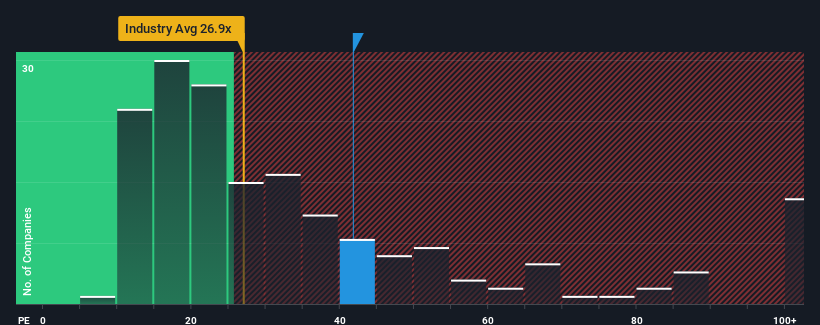
Since its price has surged higher, given around half the companies in China have price-to-earnings ratios (or "P/E's") below 29x, you may consider Sichuan Huiyu Pharmaceutical as a stock to potentially avoid with its 41.8x P/E ratio. Although, it's not wise to just take the P/E at face value as there may be an explanation why it's as high as it is.
For example, consider that Sichuan Huiyu Pharmaceutical's financial performance has been poor lately as its earnings have been in decline. It might be that many expect the company to still outplay most other companies over the coming period, which has kept the P/E from collapsing. You'd really hope so, otherwise you're paying a pretty hefty price for no particular reason.
See our latest analysis for Sichuan Huiyu Pharmaceutical
Is There Enough Growth For Sichuan Huiyu Pharmaceutical?
There's an inherent assumption that a company should outperform the market for P/E ratios like Sichuan Huiyu Pharmaceutical's to be considered reasonable.
If we review the last year of earnings, dishearteningly the company's profits fell to the tune of 46%. This means it has also seen a slide in earnings over the longer-term as EPS is down 67% in total over the last three years. Therefore, it's fair to say the earnings growth recently has been undesirable for the company.
Weighing that medium-term earnings trajectory against the broader market's one-year forecast for expansion of 41% shows it's an unpleasant look.
With this information, we find it concerning that Sichuan Huiyu Pharmaceutical is trading at a P/E higher than the market. It seems most investors are ignoring the recent poor growth rate and are hoping for a turnaround in the company's business prospects. There's a very good chance existing shareholders are setting themselves up for future disappointment if the P/E falls to levels more in line with the recent negative growth rates.
What We Can Learn From Sichuan Huiyu Pharmaceutical's P/E?
Sichuan Huiyu Pharmaceutical's P/E is getting right up there since its shares have risen strongly. We'd say the price-to-earnings ratio's power isn't primarily as a valuation instrument but rather to gauge current investor sentiment and future expectations.
We've established that Sichuan Huiyu Pharmaceutical currently trades on a much higher than expected P/E since its recent earnings have been in decline over the medium-term. When we see earnings heading backwards and underperforming the market forecasts, we suspect the share price is at risk of declining, sending the high P/E lower. Unless the recent medium-term conditions improve markedly, it's very challenging to accept these prices as being reasonable.
Before you take the next step, you should know about the 1 warning sign for Sichuan Huiyu Pharmaceutical that we have uncovered.
If these risks are making you reconsider your opinion on Sichuan Huiyu Pharmaceutical, explore our interactive list of high quality stocks to get an idea of what else is out there.
New: Manage All Your Stock Portfolios in One Place
We've created the ultimate portfolio companion for stock investors, and it's free.
• Connect an unlimited number of Portfolios and see your total in one currency
• Be alerted to new Warning Signs or Risks via email or mobile
• Track the Fair Value of your stocks
Have feedback on this article? Concerned about the content? Get in touch with us directly. Alternatively, email editorial-team (at) simplywallst.com.
This article by Simply Wall St is general in nature. We provide commentary based on historical data and analyst forecasts only using an unbiased methodology and our articles are not intended to be financial advice. It does not constitute a recommendation to buy or sell any stock, and does not take account of your objectives, or your financial situation. We aim to bring you long-term focused analysis driven by fundamental data. Note that our analysis may not factor in the latest price-sensitive company announcements or qualitative material. Simply Wall St has no position in any stocks mentioned.
About SHSE:688553
Sichuan Huiyu Pharmaceutical
Research and develops, produces, and sells anti-tumor and injection drugs in China and internationally.
Excellent balance sheet with acceptable track record.
Similar Companies
Market Insights

Advertisement
Community Narratives
Scaling up in building materials with smart M&A and growing profitability
Fair Value US$2.77|28.9% undervalued
CM
Community Contributor
Hims: The Platform Powering Personalised Healthcare
Fair Value US$114.01|46.3% undervalued
BL
Community Contributor
Undervalued lottery company with strong fundamentals
Fair Value AU$15.00|33.9% undervalued
RO
Community Contributor
Proximus, transferring money from the impatient to the patient investor
Fair Value €16.62|56.1% undervalued
AX
Community Contributor