Suzhou Zelgen Biopharmaceuticals Co.,Ltd.'s (SHSE:688266) Shares Climb 28% But Its Business Is Yet to Catch Up


Suzhou Zelgen Biopharmaceuticals Co.,Ltd. (SHSE:688266) shareholders are no doubt pleased to see that the share price has bounced 28% in the last month, although it is still struggling to make up recently lost ground. The bad news is that even after the stocks recovery in the last 30 days, shareholders are still underwater by about 8.7% over the last year.
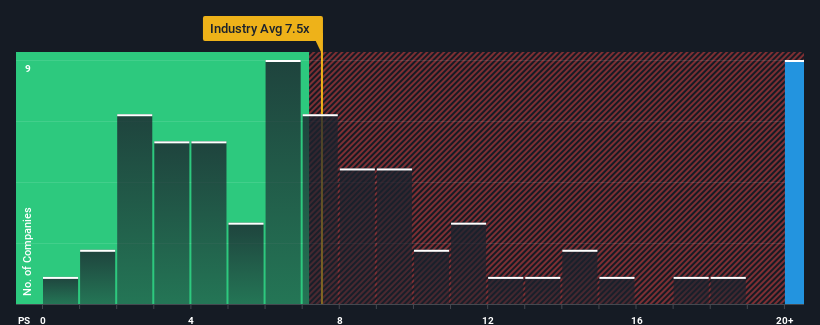
Following the firm bounce in price, given around half the companies in China's Biotechs industry have price-to-sales ratios (or "P/S") below 7.5x, you may consider Suzhou Zelgen BiopharmaceuticalsLtd as a stock to avoid entirely with its 30.5x P/S ratio. However, the P/S might be quite high for a reason and it requires further investigation to determine if it's justified.
Check out our latest analysis for Suzhou Zelgen BiopharmaceuticalsLtd
How Suzhou Zelgen BiopharmaceuticalsLtd Has Been Performing
Suzhou Zelgen BiopharmaceuticalsLtd certainly has been doing a good job lately as it's been growing revenue more than most other companies. It seems that many are expecting the strong revenue performance to persist, which has raised the P/S. If not, then existing shareholders might be a little nervous about the viability of the share price.
If you'd like to see what analysts are forecasting going forward, you should check out our free report on Suzhou Zelgen BiopharmaceuticalsLtd.Do Revenue Forecasts Match The High P/S Ratio?
Suzhou Zelgen BiopharmaceuticalsLtd's P/S ratio would be typical for a company that's expected to deliver very strong growth, and importantly, perform much better than the industry.
If we review the last year of revenue growth, the company posted a terrific increase of 28%. The latest three year period has also seen an incredible overall rise in revenue, aided by its incredible short-term performance. Accordingly, shareholders would have been over the moon with those medium-term rates of revenue growth.
Looking ahead now, revenue is anticipated to climb by 163% during the coming year according to the three analysts following the company. Meanwhile, the rest of the industry is forecast to expand by 163%, which is not materially different.
With this in consideration, we find it intriguing that Suzhou Zelgen BiopharmaceuticalsLtd's P/S is higher than its industry peers. Apparently many investors in the company are more bullish than analysts indicate and aren't willing to let go of their stock right now. These shareholders may be setting themselves up for disappointment if the P/S falls to levels more in line with the growth outlook.
What Does Suzhou Zelgen BiopharmaceuticalsLtd's P/S Mean For Investors?
Shares in Suzhou Zelgen BiopharmaceuticalsLtd have seen a strong upwards swing lately, which has really helped boost its P/S figure. Typically, we'd caution against reading too much into price-to-sales ratios when settling on investment decisions, though it can reveal plenty about what other market participants think about the company.
Analysts are forecasting Suzhou Zelgen BiopharmaceuticalsLtd's revenues to only grow on par with the rest of the industry, which has lead to the high P/S ratio being unexpected. Right now we are uncomfortable with the relatively high share price as the predicted future revenues aren't likely to support such positive sentiment for long. A positive change is needed in order to justify the current price-to-sales ratio.
You always need to take note of risks, for example - Suzhou Zelgen BiopharmaceuticalsLtd has 1 warning sign we think you should be aware of.
If companies with solid past earnings growth is up your alley, you may wish to see this free collection of other companies with strong earnings growth and low P/E ratios.
New: Manage All Your Stock Portfolios in One Place
We've created the ultimate portfolio companion for stock investors, and it's free.
• Connect an unlimited number of Portfolios and see your total in one currency
• Be alerted to new Warning Signs or Risks via email or mobile
• Track the Fair Value of your stocks
Have feedback on this article? Concerned about the content? Get in touch with us directly. Alternatively, email editorial-team (at) simplywallst.com.
This article by Simply Wall St is general in nature. We provide commentary based on historical data and analyst forecasts only using an unbiased methodology and our articles are not intended to be financial advice. It does not constitute a recommendation to buy or sell any stock, and does not take account of your objectives, or your financial situation. We aim to bring you long-term focused analysis driven by fundamental data. Note that our analysis may not factor in the latest price-sensitive company announcements or qualitative material. Simply Wall St has no position in any stocks mentioned.
About SHSE:688266
Suzhou Zelgen BiopharmaceuticalsLtd
Suzhou Zelgen Biopharmaceuticals Co.,Ltd.
High growth potential with adequate balance sheet.
Market Insights

Community Narratives


