Xinjiang Bai Hua Cun Pharma Tech Co.,Ltd's (SHSE:600721) P/S Is Still On The Mark Following 34% Share Price Bounce


Xinjiang Bai Hua Cun Pharma Tech Co.,Ltd (SHSE:600721) shareholders are no doubt pleased to see that the share price has bounced 34% in the last month, although it is still struggling to make up recently lost ground. While recent buyers may be laughing, long-term holders might not be as pleased since the recent gain only brings the stock back to where it started a year ago.
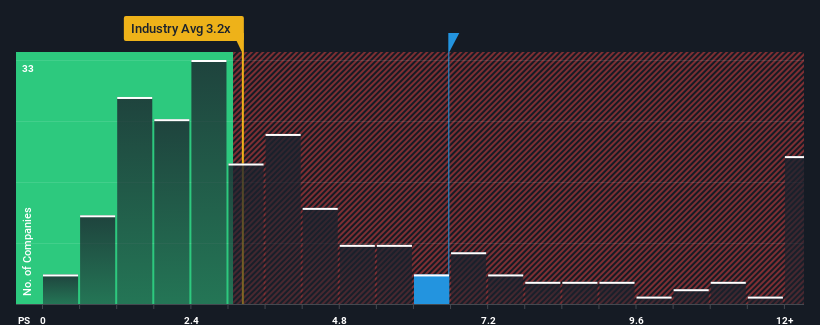
After such a large jump in price, when almost half of the companies in China's Pharmaceuticals industry have price-to-sales ratios (or "P/S") below 3.2x, you may consider Xinjiang Bai Hua Cun Pharma TechLtd as a stock not worth researching with its 6.6x P/S ratio. However, the P/S might be quite high for a reason and it requires further investigation to determine if it's justified.
View our latest analysis for Xinjiang Bai Hua Cun Pharma TechLtd
How Has Xinjiang Bai Hua Cun Pharma TechLtd Performed Recently?
For example, consider that Xinjiang Bai Hua Cun Pharma TechLtd's financial performance has been pretty ordinary lately as revenue growth is non-existent. One possibility is that the P/S is high because investors think the benign revenue growth will improve to outperform the broader industry in the near future. If not, then existing shareholders may be a little nervous about the viability of the share price.
Want the full picture on earnings, revenue and cash flow for the company? Then our free report on Xinjiang Bai Hua Cun Pharma TechLtd will help you shine a light on its historical performance.How Is Xinjiang Bai Hua Cun Pharma TechLtd's Revenue Growth Trending?
In order to justify its P/S ratio, Xinjiang Bai Hua Cun Pharma TechLtd would need to produce outstanding growth that's well in excess of the industry.
Taking a look back first, we see that there was hardly any revenue growth to speak of for the company over the past year. However, a few strong years before that means that it was still able to grow revenue by an impressive 154% in total over the last three years. Accordingly, shareholders will be pleased, but also have some questions to ponder about the last 12 months.
This is in contrast to the rest of the industry, which is expected to grow by 17% over the next year, materially lower than the company's recent medium-term annualised growth rates.
With this information, we can see why Xinjiang Bai Hua Cun Pharma TechLtd is trading at such a high P/S compared to the industry. Presumably shareholders aren't keen to offload something they believe will continue to outmanoeuvre the wider industry.
The Key Takeaway
The strong share price surge has lead to Xinjiang Bai Hua Cun Pharma TechLtd's P/S soaring as well. Generally, our preference is to limit the use of the price-to-sales ratio to establishing what the market thinks about the overall health of a company.
It's no surprise that Xinjiang Bai Hua Cun Pharma TechLtd can support its high P/S given the strong revenue growth its experienced over the last three-year is superior to the current industry outlook. Right now shareholders are comfortable with the P/S as they are quite confident revenue aren't under threat. Unless the recent medium-term conditions change, they will continue to provide strong support to the share price.
Many other vital risk factors can be found on the company's balance sheet. Our free balance sheet analysis for Xinjiang Bai Hua Cun Pharma TechLtd with six simple checks will allow you to discover any risks that could be an issue.
If companies with solid past earnings growth is up your alley, you may wish to see this free collection of other companies with strong earnings growth and low P/E ratios.
New: AI Stock Screener & Alerts
Our new AI Stock Screener scans the market every day to uncover opportunities.
• Dividend Powerhouses (3%+ Yield)
• Undervalued Small Caps with Insider Buying
• High growth Tech and AI Companies
Or build your own from over 50 metrics.
Have feedback on this article? Concerned about the content? Get in touch with us directly. Alternatively, email editorial-team (at) simplywallst.com.
This article by Simply Wall St is general in nature. We provide commentary based on historical data and analyst forecasts only using an unbiased methodology and our articles are not intended to be financial advice. It does not constitute a recommendation to buy or sell any stock, and does not take account of your objectives, or your financial situation. We aim to bring you long-term focused analysis driven by fundamental data. Note that our analysis may not factor in the latest price-sensitive company announcements or qualitative material. Simply Wall St has no position in any stocks mentioned.
About SHSE:600721
Xinjiang Bai Hua Cun Pharma TechLtd
Engages in the pharmaceutical research and development, clinical trials, biomedicine, commercial properties, and other businesses.
Flawless balance sheet with acceptable track record.
Market Insights

Community Narratives
