Zhejiang Huahai Pharmaceutical Co., Ltd.'s (SHSE:600521) Intrinsic Value Is Potentially 89% Above Its Share Price


Key Insights
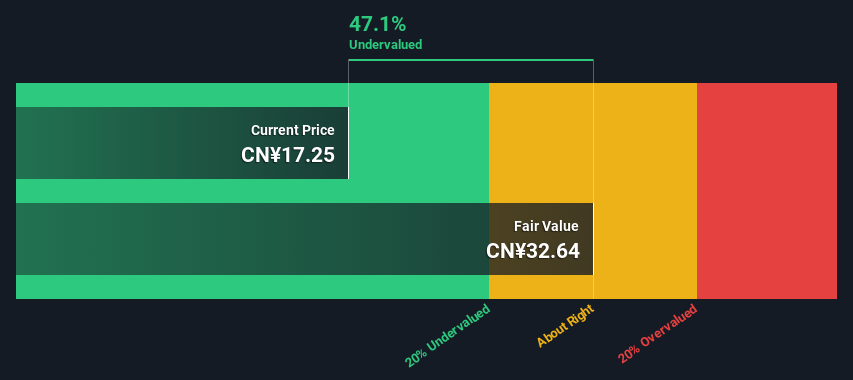
- The projected fair value for Zhejiang Huahai Pharmaceutical is CN¥32.64 based on 2 Stage Free Cash Flow to Equity
- Zhejiang Huahai Pharmaceutical's CN¥17.25 share price signals that it might be 47% undervalued
- Peers of Zhejiang Huahai Pharmaceutical are currently trading on average at a 143% premium
In this article we are going to estimate the intrinsic value of Zhejiang Huahai Pharmaceutical Co., Ltd. (SHSE:600521) by taking the expected future cash flows and discounting them to their present value. Our analysis will employ the Discounted Cash Flow (DCF) model. Believe it or not, it's not too difficult to follow, as you'll see from our example!
We generally believe that a company's value is the present value of all of the cash it will generate in the future. However, a DCF is just one valuation metric among many, and it is not without flaws. If you want to learn more about discounted cash flow, the rationale behind this calculation can be read in detail in the Simply Wall St analysis model.
See our latest analysis for Zhejiang Huahai Pharmaceutical
Crunching The Numbers
We use what is known as a 2-stage model, which simply means we have two different periods of growth rates for the company's cash flows. Generally the first stage is higher growth, and the second stage is a lower growth phase. To begin with, we have to get estimates of the next ten years of cash flows. Seeing as no analyst estimates of free cash flow are available to us, we have extrapolate the previous free cash flow (FCF) from the company's last reported value. We assume companies with shrinking free cash flow will slow their rate of shrinkage, and that companies with growing free cash flow will see their growth rate slow, over this period. We do this to reflect that growth tends to slow more in the early years than it does in later years.
A DCF is all about the idea that a dollar in the future is less valuable than a dollar today, and so the sum of these future cash flows is then discounted to today's value:
10-year free cash flow (FCF) forecast
| 2024 | 2025 | 2026 | 2027 | 2028 | 2029 | 2030 | 2031 | 2032 | 2033 | |
| Levered FCF (CN¥, Millions) | CN¥683.3m | CN¥1.01b | CN¥1.36b | CN¥1.70b | CN¥2.01b | CN¥2.29b | CN¥2.53b | CN¥2.73b | CN¥2.91b | CN¥3.08b |
| Growth Rate Estimate Source | Est @ 67.30% | Est @ 47.98% | Est @ 34.46% | Est @ 24.99% | Est @ 18.36% | Est @ 13.72% | Est @ 10.48% | Est @ 8.20% | Est @ 6.61% | Est @ 5.50% |
| Present Value (CN¥, Millions) Discounted @ 7.4% | CN¥636 | CN¥876 | CN¥1.1k | CN¥1.3k | CN¥1.4k | CN¥1.5k | CN¥1.5k | CN¥1.5k | CN¥1.5k | CN¥1.5k |
("Est" = FCF growth rate estimated by Simply Wall St)
Present Value of 10-year Cash Flow (PVCF) = CN¥13b
We now need to calculate the Terminal Value, which accounts for all the future cash flows after this ten year period. For a number of reasons a very conservative growth rate is used that cannot exceed that of a country's GDP growth. In this case we have used the 5-year average of the 10-year government bond yield (2.9%) to estimate future growth. In the same way as with the 10-year 'growth' period, we discount future cash flows to today's value, using a cost of equity of 7.4%.
Terminal Value (TV)= FCF2033 × (1 + g) ÷ (r – g) = CN¥3.1b× (1 + 2.9%) ÷ (7.4%– 2.9%) = CN¥70b
Present Value of Terminal Value (PVTV)= TV / (1 + r)10= CN¥70b÷ ( 1 + 7.4%)10= CN¥34b
The total value, or equity value, is then the sum of the present value of the future cash flows, which in this case is CN¥47b. The last step is to then divide the equity value by the number of shares outstanding. Compared to the current share price of CN¥17.3, the company appears quite good value at a 47% discount to where the stock price trades currently. Remember though, that this is just an approximate valuation, and like any complex formula - garbage in, garbage out.
The Assumptions
We would point out that the most important inputs to a discounted cash flow are the discount rate and of course the actual cash flows. Part of investing is coming up with your own evaluation of a company's future performance, so try the calculation yourself and check your own assumptions. The DCF also does not consider the possible cyclicality of an industry, or a company's future capital requirements, so it does not give a full picture of a company's potential performance. Given that we are looking at Zhejiang Huahai Pharmaceutical as potential shareholders, the cost of equity is used as the discount rate, rather than the cost of capital (or weighted average cost of capital, WACC) which accounts for debt. In this calculation we've used 7.4%, which is based on a levered beta of 0.800. Beta is a measure of a stock's volatility, compared to the market as a whole. We get our beta from the industry average beta of globally comparable companies, with an imposed limit between 0.8 and 2.0, which is a reasonable range for a stable business.
SWOT Analysis for Zhejiang Huahai Pharmaceutical
- Debt is well covered by earnings and cashflows.
- Dividends are covered by earnings and cash flows.
- Earnings declined over the past year.
- Dividend is low compared to the top 25% of dividend payers in the Pharmaceuticals market.
- Annual earnings are forecast to grow for the next 3 years.
- Good value based on P/E ratio and estimated fair value.
- No apparent threats visible for 600521.
Moving On:
Valuation is only one side of the coin in terms of building your investment thesis, and it ideally won't be the sole piece of analysis you scrutinize for a company. The DCF model is not a perfect stock valuation tool. Preferably you'd apply different cases and assumptions and see how they would impact the company's valuation. For example, changes in the company's cost of equity or the risk free rate can significantly impact the valuation. What is the reason for the share price sitting below the intrinsic value? For Zhejiang Huahai Pharmaceutical, we've compiled three fundamental aspects you should further research:
- Risks: For instance, we've identified 2 warning signs for Zhejiang Huahai Pharmaceutical that you should be aware of.
- Future Earnings: How does 600521's growth rate compare to its peers and the wider market? Dig deeper into the analyst consensus number for the upcoming years by interacting with our free analyst growth expectation chart.
- Other High Quality Alternatives: Do you like a good all-rounder? Explore our interactive list of high quality stocks to get an idea of what else is out there you may be missing!
PS. Simply Wall St updates its DCF calculation for every Chinese stock every day, so if you want to find the intrinsic value of any other stock just search here.
If you're looking to trade Zhejiang Huahai Pharmaceutical, open an account with the lowest-cost platform trusted by professionals, Interactive Brokers.
With clients in over 200 countries and territories, and access to 160 markets, IBKR lets you trade stocks, options, futures, forex, bonds and funds from a single integrated account.
Enjoy no hidden fees, no account minimums, and FX conversion rates as low as 0.03%, far better than what most brokers offer.
Sponsored ContentValuation is complex, but we're here to simplify it.
Discover if Zhejiang Huahai Pharmaceutical might be undervalued or overvalued with our detailed analysis, featuring fair value estimates, potential risks, dividends, insider trades, and its financial condition.
Access Free AnalysisHave feedback on this article? Concerned about the content? Get in touch with us directly. Alternatively, email editorial-team (at) simplywallst.com.
This article by Simply Wall St is general in nature. We provide commentary based on historical data and analyst forecasts only using an unbiased methodology and our articles are not intended to be financial advice. It does not constitute a recommendation to buy or sell any stock, and does not take account of your objectives, or your financial situation. We aim to bring you long-term focused analysis driven by fundamental data. Note that our analysis may not factor in the latest price-sensitive company announcements or qualitative material. Simply Wall St has no position in any stocks mentioned.
Have feedback on this article? Concerned about the content? Get in touch with us directly. Alternatively, email editorial-team@simplywallst.com
About SHSE:600521
Zhejiang Huahai Pharmaceutical
Operates as a pharmaceutical company in China and internationally.
Solid track record and fair value.
Market Insights

Community Narratives


