Does Joincare Pharmaceutical Group IndustryLtd (SHSE:600380) Have A Healthy Balance Sheet?


The external fund manager backed by Berkshire Hathaway's Charlie Munger, Li Lu, makes no bones about it when he says 'The biggest investment risk is not the volatility of prices, but whether you will suffer a permanent loss of capital.' So it seems the smart money knows that debt - which is usually involved in bankruptcies - is a very important factor, when you assess how risky a company is. As with many other companies Joincare Pharmaceutical Group Industry Co.,Ltd. (SHSE:600380) makes use of debt. But the real question is whether this debt is making the company risky.
What Risk Does Debt Bring?
Debt is a tool to help businesses grow, but if a business is incapable of paying off its lenders, then it exists at their mercy. If things get really bad, the lenders can take control of the business. While that is not too common, we often do see indebted companies permanently diluting shareholders because lenders force them to raise capital at a distressed price. Of course, debt can be an important tool in businesses, particularly capital heavy businesses. When we examine debt levels, we first consider both cash and debt levels, together.
Check out our latest analysis for Joincare Pharmaceutical Group IndustryLtd
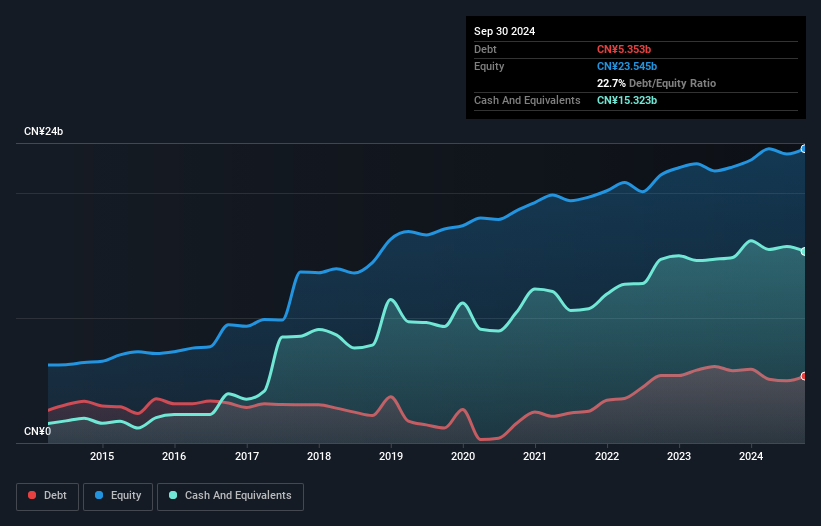
What Is Joincare Pharmaceutical Group IndustryLtd's Net Debt?
As you can see below, Joincare Pharmaceutical Group IndustryLtd had CN¥5.35b of debt at September 2024, down from CN¥5.79b a year prior. However, it does have CN¥15.3b in cash offsetting this, leading to net cash of CN¥9.97b.
How Strong Is Joincare Pharmaceutical Group IndustryLtd's Balance Sheet?
We can see from the most recent balance sheet that Joincare Pharmaceutical Group IndustryLtd had liabilities of CN¥10.6b falling due within a year, and liabilities of CN¥2.06b due beyond that. Offsetting these obligations, it had cash of CN¥15.3b as well as receivables valued at CN¥4.60b due within 12 months. So it can boast CN¥7.29b more liquid assets than total liabilities.
This surplus strongly suggests that Joincare Pharmaceutical Group IndustryLtd has a rock-solid balance sheet (and the debt is of no concern whatsoever). With this in mind one could posit that its balance sheet means the company is able to handle some adversity. Succinctly put, Joincare Pharmaceutical Group IndustryLtd boasts net cash, so it's fair to say it does not have a heavy debt load!
The good news is that Joincare Pharmaceutical Group IndustryLtd has increased its EBIT by 8.5% over twelve months, which should ease any concerns about debt repayment. There's no doubt that we learn most about debt from the balance sheet. But ultimately the future profitability of the business will decide if Joincare Pharmaceutical Group IndustryLtd can strengthen its balance sheet over time. So if you're focused on the future you can check out this free report showing analyst profit forecasts.
Finally, a business needs free cash flow to pay off debt; accounting profits just don't cut it. While Joincare Pharmaceutical Group IndustryLtd has net cash on its balance sheet, it's still worth taking a look at its ability to convert earnings before interest and tax (EBIT) to free cash flow, to help us understand how quickly it is building (or eroding) that cash balance. Over the last three years, Joincare Pharmaceutical Group IndustryLtd recorded free cash flow worth a fulsome 90% of its EBIT, which is stronger than we'd usually expect. That puts it in a very strong position to pay down debt.
Summing Up
While it is always sensible to investigate a company's debt, in this case Joincare Pharmaceutical Group IndustryLtd has CN¥9.97b in net cash and a decent-looking balance sheet. The cherry on top was that in converted 90% of that EBIT to free cash flow, bringing in CN¥3.0b. So we don't think Joincare Pharmaceutical Group IndustryLtd's use of debt is risky. Above most other metrics, we think its important to track how fast earnings per share is growing, if at all. If you've also come to that realization, you're in luck, because today you can view this interactive graph of Joincare Pharmaceutical Group IndustryLtd's earnings per share history for free.
At the end of the day, it's often better to focus on companies that are free from net debt. You can access our special list of such companies (all with a track record of profit growth). It's free.
If you're looking to trade Joincare Pharmaceutical Group IndustryLtd, open an account with the lowest-cost platform trusted by professionals, Interactive Brokers.
With clients in over 200 countries and territories, and access to 160 markets, IBKR lets you trade stocks, options, futures, forex, bonds and funds from a single integrated account.
Enjoy no hidden fees, no account minimums, and FX conversion rates as low as 0.03%, far better than what most brokers offer.
Sponsored ContentNew: Manage All Your Stock Portfolios in One Place
We've created the ultimate portfolio companion for stock investors, and it's free.
• Connect an unlimited number of Portfolios and see your total in one currency
• Be alerted to new Warning Signs or Risks via email or mobile
• Track the Fair Value of your stocks
Have feedback on this article? Concerned about the content? Get in touch with us directly. Alternatively, email editorial-team (at) simplywallst.com.
This article by Simply Wall St is general in nature. We provide commentary based on historical data and analyst forecasts only using an unbiased methodology and our articles are not intended to be financial advice. It does not constitute a recommendation to buy or sell any stock, and does not take account of your objectives, or your financial situation. We aim to bring you long-term focused analysis driven by fundamental data. Note that our analysis may not factor in the latest price-sensitive company announcements or qualitative material. Simply Wall St has no position in any stocks mentioned.
About SHSE:600380
Joincare Pharmaceutical Group IndustryLtd
Joincare Pharmaceutical Group Industry Co.,Ltd.
Undervalued with excellent balance sheet and pays a dividend.
Market Insights

Community Narratives


