The Market Doesn't Like What It Sees From Henan Taloph Pharmaceutical Stock Co.,Ltd's (SHSE:600222) Revenues Yet


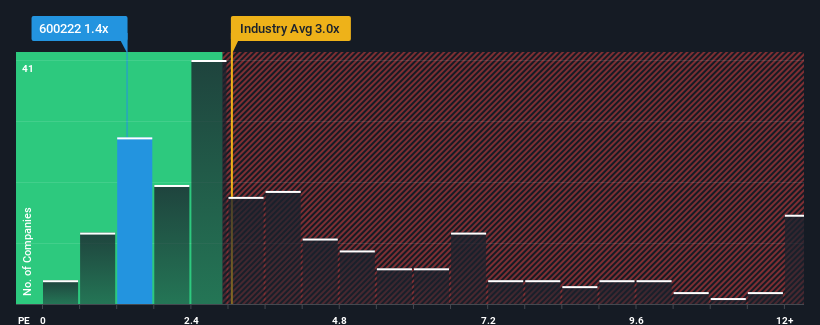
With a price-to-sales (or "P/S") ratio of 1.4x Henan Taloph Pharmaceutical Stock Co.,Ltd (SHSE:600222) may be sending bullish signals at the moment, given that almost half of all the Pharmaceuticals companies in China have P/S ratios greater than 3x and even P/S higher than 6x are not unusual. However, the P/S might be low for a reason and it requires further investigation to determine if it's justified.
Check out our latest analysis for Henan Taloph Pharmaceutical StockLtd
What Does Henan Taloph Pharmaceutical StockLtd's P/S Mean For Shareholders?
As an illustration, revenue has deteriorated at Henan Taloph Pharmaceutical StockLtd over the last year, which is not ideal at all. One possibility is that the P/S is low because investors think the company won't do enough to avoid underperforming the broader industry in the near future. Those who are bullish on Henan Taloph Pharmaceutical StockLtd will be hoping that this isn't the case so that they can pick up the stock at a lower valuation.
Although there are no analyst estimates available for Henan Taloph Pharmaceutical StockLtd, take a look at this free data-rich visualisation to see how the company stacks up on earnings, revenue and cash flow.What Are Revenue Growth Metrics Telling Us About The Low P/S?
There's an inherent assumption that a company should underperform the industry for P/S ratios like Henan Taloph Pharmaceutical StockLtd's to be considered reasonable.
Retrospectively, the last year delivered a frustrating 4.2% decrease to the company's top line. However, a few very strong years before that means that it was still able to grow revenue by an impressive 32% in total over the last three years. Accordingly, while they would have preferred to keep the run going, shareholders would definitely welcome the medium-term rates of revenue growth.
Comparing that to the industry, which is predicted to deliver 135% growth in the next 12 months, the company's momentum is weaker, based on recent medium-term annualised revenue results.
With this information, we can see why Henan Taloph Pharmaceutical StockLtd is trading at a P/S lower than the industry. Apparently many shareholders weren't comfortable holding on to something they believe will continue to trail the wider industry.
The Key Takeaway
We'd say the price-to-sales ratio's power isn't primarily as a valuation instrument but rather to gauge current investor sentiment and future expectations.
As we suspected, our examination of Henan Taloph Pharmaceutical StockLtd revealed its three-year revenue trends are contributing to its low P/S, given they look worse than current industry expectations. At this stage investors feel the potential for an improvement in revenue isn't great enough to justify a higher P/S ratio. Unless the recent medium-term conditions improve, they will continue to form a barrier for the share price around these levels.
The company's balance sheet is another key area for risk analysis. You can assess many of the main risks through our free balance sheet analysis for Henan Taloph Pharmaceutical StockLtd with six simple checks.
Of course, profitable companies with a history of great earnings growth are generally safer bets. So you may wish to see this free collection of other companies that have reasonable P/E ratios and have grown earnings strongly.
If you're looking to trade Henan Taloph Pharmaceutical StockLtd, open an account with the lowest-cost platform trusted by professionals, Interactive Brokers.
With clients in over 200 countries and territories, and access to 160 markets, IBKR lets you trade stocks, options, futures, forex, bonds and funds from a single integrated account.
Enjoy no hidden fees, no account minimums, and FX conversion rates as low as 0.03%, far better than what most brokers offer.
Sponsored ContentValuation is complex, but we're here to simplify it.
Discover if Henan Taloph Pharmaceutical StockLtd might be undervalued or overvalued with our detailed analysis, featuring fair value estimates, potential risks, dividends, insider trades, and its financial condition.
Access Free AnalysisHave feedback on this article? Concerned about the content? Get in touch with us directly. Alternatively, email editorial-team (at) simplywallst.com.
This article by Simply Wall St is general in nature. We provide commentary based on historical data and analyst forecasts only using an unbiased methodology and our articles are not intended to be financial advice. It does not constitute a recommendation to buy or sell any stock, and does not take account of your objectives, or your financial situation. We aim to bring you long-term focused analysis driven by fundamental data. Note that our analysis may not factor in the latest price-sensitive company announcements or qualitative material. Simply Wall St has no position in any stocks mentioned.
About SHSE:600222
Henan Taloph Pharmaceutical StockLtd
Engages in the research, development, and sale of pharmaceutical preparations and Chinese herbal medicines in China.
Adequate balance sheet second-rate dividend payer.
Similar Companies
Market Insights

Community Narratives


