
Advertisement
Henan Taloph Pharmaceutical Stock Co.,Ltd (SHSE:600222) Surges 26% Yet Its Low P/S Is No Reason For Excitement

Henan Taloph Pharmaceutical Stock Co.,Ltd (SHSE:600222) shareholders are no doubt pleased to see that the share price has bounced 26% in the last month, although it is still struggling to make up recently lost ground. Unfortunately, the gains of the last month did little to right the losses of the last year with the stock still down 19% over that time.
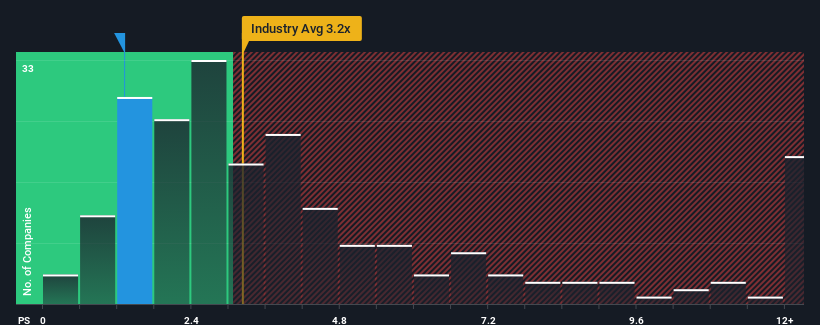
In spite of the firm bounce in price, Henan Taloph Pharmaceutical StockLtd may still be sending bullish signals at the moment with its price-to-sales (or "P/S") ratio of 1.3x, since almost half of all companies in the Pharmaceuticals industry in China have P/S ratios greater than 3.2x and even P/S higher than 6x are not unusual. Nonetheless, we'd need to dig a little deeper to determine if there is a rational basis for the reduced P/S.
Check out our latest analysis for Henan Taloph Pharmaceutical StockLtd
How Henan Taloph Pharmaceutical StockLtd Has Been Performing
Henan Taloph Pharmaceutical StockLtd has been doing a good job lately as it's been growing revenue at a solid pace. Perhaps the market is expecting this acceptable revenue performance to take a dive, which has kept the P/S suppressed. If that doesn't eventuate, then existing shareholders have reason to be optimistic about the future direction of the share price.
Want the full picture on earnings, revenue and cash flow for the company? Then our free report on Henan Taloph Pharmaceutical StockLtd will help you shine a light on its historical performance.Is There Any Revenue Growth Forecasted For Henan Taloph Pharmaceutical StockLtd?
In order to justify its P/S ratio, Henan Taloph Pharmaceutical StockLtd would need to produce sluggish growth that's trailing the industry.
Taking a look back first, we see that the company grew revenue by an impressive 18% last year. The latest three year period has also seen an excellent 52% overall rise in revenue, aided by its short-term performance. Therefore, it's fair to say the revenue growth recently has been superb for the company.
This is in contrast to the rest of the industry, which is expected to grow by 17% over the next year, materially higher than the company's recent medium-term annualised growth rates.
With this information, we can see why Henan Taloph Pharmaceutical StockLtd is trading at a P/S lower than the industry. It seems most investors are expecting to see the recent limited growth rates continue into the future and are only willing to pay a reduced amount for the stock.
The Bottom Line On Henan Taloph Pharmaceutical StockLtd's P/S
The latest share price surge wasn't enough to lift Henan Taloph Pharmaceutical StockLtd's P/S close to the industry median. Generally, our preference is to limit the use of the price-to-sales ratio to establishing what the market thinks about the overall health of a company.
In line with expectations, Henan Taloph Pharmaceutical StockLtd maintains its low P/S on the weakness of its recent three-year growth being lower than the wider industry forecast. Right now shareholders are accepting the low P/S as they concede future revenue probably won't provide any pleasant surprises. If recent medium-term revenue trends continue, it's hard to see the share price experience a reversal of fortunes anytime soon.
You should always think about risks. Case in point, we've spotted 1 warning sign for Henan Taloph Pharmaceutical StockLtd you should be aware of.
If these risks are making you reconsider your opinion on Henan Taloph Pharmaceutical StockLtd, explore our interactive list of high quality stocks to get an idea of what else is out there.
Valuation is complex, but we're here to simplify it.
Discover if Henan Taloph Pharmaceutical StockLtd might be undervalued or overvalued with our detailed analysis, featuring fair value estimates, potential risks, dividends, insider trades, and its financial condition.
Access Free AnalysisHave feedback on this article? Concerned about the content? Get in touch with us directly. Alternatively, email editorial-team (at) simplywallst.com.
This article by Simply Wall St is general in nature. We provide commentary based on historical data and analyst forecasts only using an unbiased methodology and our articles are not intended to be financial advice. It does not constitute a recommendation to buy or sell any stock, and does not take account of your objectives, or your financial situation. We aim to bring you long-term focused analysis driven by fundamental data. Note that our analysis may not factor in the latest price-sensitive company announcements or qualitative material. Simply Wall St has no position in any stocks mentioned.
About SHSE:600222
Henan Taloph Pharmaceutical StockLtd
Engages in the research, development, and sale of pharmaceutical preparations and Chinese herbal medicines in China.
Adequate balance sheet second-rate dividend payer.
Similar Companies
Market Insights

Advertisement
Community Narratives

Apple: A Dying Star with an Overpriced Valuation
Fair Value US$177.34|19.1% overvalued
IN
Community Contributor
Avino a case for USD$20 per share within 5 years (assuming $3,500 gold, $100 silver and $4 copper).
Fair Value CA$26.79|86.0% undervalued
AG
Community Contributor
Riding the Defense Boom RENK Sees Revenue Climb at 15% CAGR by FY 2029
Fair Value €69.87|14.3% undervalued
CH
Community Contributor