Zhejiang Meorient Commerce Exhibition Inc.'s (SZSE:300795) 37% Jump Shows Its Popularity With Investors

Zhejiang Meorient Commerce Exhibition Inc. (SZSE:300795) shares have had a really impressive month, gaining 37% after a shaky period beforehand. Taking a wider view, although not as strong as the last month, the full year gain of 16% is also fairly reasonable.
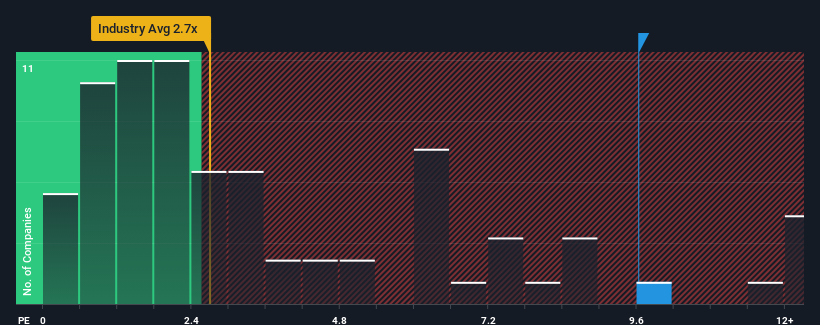
After such a large jump in price, when almost half of the companies in China's Media industry have price-to-sales ratios (or "P/S") below 2.7x, you may consider Zhejiang Meorient Commerce Exhibition as a stock not worth researching with its 9.6x P/S ratio. Although, it's not wise to just take the P/S at face value as there may be an explanation why it's so lofty.
Check out our latest analysis for Zhejiang Meorient Commerce Exhibition

What Does Zhejiang Meorient Commerce Exhibition's P/S Mean For Shareholders?
With revenue growth that's superior to most other companies of late, Zhejiang Meorient Commerce Exhibition has been doing relatively well. It seems the market expects this form will continue into the future, hence the elevated P/S ratio. However, if this isn't the case, investors might get caught out paying too much for the stock.
Want the full picture on analyst estimates for the company? Then our free report on Zhejiang Meorient Commerce Exhibition will help you uncover what's on the horizon.How Is Zhejiang Meorient Commerce Exhibition's Revenue Growth Trending?
The only time you'd be truly comfortable seeing a P/S as steep as Zhejiang Meorient Commerce Exhibition's is when the company's growth is on track to outshine the industry decidedly.
Taking a look back first, we see that the company grew revenue by an impressive 201% last year. The latest three year period has also seen an excellent 196% overall rise in revenue, aided by its short-term performance. Accordingly, shareholders would have definitely welcomed those medium-term rates of revenue growth.
Looking ahead now, revenue is anticipated to climb by 46% during the coming year according to the three analysts following the company. With the industry only predicted to deliver 20%, the company is positioned for a stronger revenue result.
In light of this, it's understandable that Zhejiang Meorient Commerce Exhibition's P/S sits above the majority of other companies. Apparently shareholders aren't keen to offload something that is potentially eyeing a more prosperous future.
What We Can Learn From Zhejiang Meorient Commerce Exhibition's P/S?
Shares in Zhejiang Meorient Commerce Exhibition have seen a strong upwards swing lately, which has really helped boost its P/S figure. Typically, we'd caution against reading too much into price-to-sales ratios when settling on investment decisions, though it can reveal plenty about what other market participants think about the company.
As we suspected, our examination of Zhejiang Meorient Commerce Exhibition's analyst forecasts revealed that its superior revenue outlook is contributing to its high P/S. At this stage investors feel the potential for a deterioration in revenues is quite remote, justifying the elevated P/S ratio. Unless the analysts have really missed the mark, these strong revenue forecasts should keep the share price buoyant.
Many other vital risk factors can be found on the company's balance sheet. You can assess many of the main risks through our free balance sheet analysis for Zhejiang Meorient Commerce Exhibition with six simple checks.
Of course, profitable companies with a history of great earnings growth are generally safer bets. So you may wish to see this free collection of other companies that have reasonable P/E ratios and have grown earnings strongly.
Valuation is complex, but we're here to simplify it.
Discover if Zhejiang Meorient Commerce Exhibition might be undervalued or overvalued with our detailed analysis, featuring fair value estimates, potential risks, dividends, insider trades, and its financial condition.
Access Free AnalysisHave feedback on this article? Concerned about the content? Get in touch with us directly. Alternatively, email editorial-team (at) simplywallst.com.
This article by Simply Wall St is general in nature. We provide commentary based on historical data and analyst forecasts only using an unbiased methodology and our articles are not intended to be financial advice. It does not constitute a recommendation to buy or sell any stock, and does not take account of your objectives, or your financial situation. We aim to bring you long-term focused analysis driven by fundamental data. Note that our analysis may not factor in the latest price-sensitive company announcements or qualitative material. Simply Wall St has no position in any stocks mentioned.
About SZSE:300795
Zhejiang Meorient Commerce Exhibition
Zhejiang Meorient Commerce Exhibition Inc.
Exceptional growth potential with flawless balance sheet.
Market Insights
Community Narratives


