- China
- /
- Entertainment
- /
- SZSE:300299
Fuchun Technology Co., Ltd.'s (SZSE:300299) 27% Price Boost Is Out Of Tune With Revenues


Fuchun Technology Co., Ltd. (SZSE:300299) shareholders are no doubt pleased to see that the share price has bounced 27% in the last month, although it is still struggling to make up recently lost ground. Unfortunately, the gains of the last month did little to right the losses of the last year with the stock still down 17% over that time.
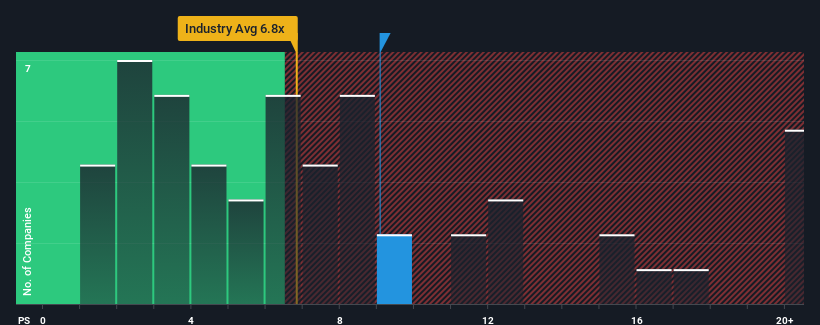
After such a large jump in price, Fuchun Technology's price-to-sales (or "P/S") ratio of 9.1x might make it look like a sell right now compared to the wider Entertainment industry in China, where around half of the companies have P/S ratios below 6.8x and even P/S below 3x are quite common. However, the P/S might be high for a reason and it requires further investigation to determine if it's justified.
Check out our latest analysis for Fuchun Technology
What Does Fuchun Technology's Recent Performance Look Like?
As an illustration, revenue has deteriorated at Fuchun Technology over the last year, which is not ideal at all. Perhaps the market believes the company can do enough to outperform the rest of the industry in the near future, which is keeping the P/S ratio high. However, if this isn't the case, investors might get caught out paying too much for the stock.
Although there are no analyst estimates available for Fuchun Technology, take a look at this free data-rich visualisation to see how the company stacks up on earnings, revenue and cash flow.How Is Fuchun Technology's Revenue Growth Trending?
The only time you'd be truly comfortable seeing a P/S as high as Fuchun Technology's is when the company's growth is on track to outshine the industry.
Retrospectively, the last year delivered a frustrating 14% decrease to the company's top line. As a result, revenue from three years ago have also fallen 11% overall. Therefore, it's fair to say the revenue growth recently has been undesirable for the company.
Comparing that to the industry, which is predicted to deliver 32% growth in the next 12 months, the company's downward momentum based on recent medium-term revenue results is a sobering picture.
In light of this, it's alarming that Fuchun Technology's P/S sits above the majority of other companies. Apparently many investors in the company are way more bullish than recent times would indicate and aren't willing to let go of their stock at any price. Only the boldest would assume these prices are sustainable as a continuation of recent revenue trends is likely to weigh heavily on the share price eventually.
What We Can Learn From Fuchun Technology's P/S?
The large bounce in Fuchun Technology's shares has lifted the company's P/S handsomely. It's argued the price-to-sales ratio is an inferior measure of value within certain industries, but it can be a powerful business sentiment indicator.
Our examination of Fuchun Technology revealed its shrinking revenue over the medium-term isn't resulting in a P/S as low as we expected, given the industry is set to grow. When we see revenue heading backwards and underperforming the industry forecasts, we feel the possibility of the share price declining is very real, bringing the P/S back into the realm of reasonability. Unless the recent medium-term conditions improve markedly, investors will have a hard time accepting the share price as fair value.
It is also worth noting that we have found 3 warning signs for Fuchun Technology that you need to take into consideration.
If you're unsure about the strength of Fuchun Technology's business, why not explore our interactive list of stocks with solid business fundamentals for some other companies you may have missed.
New: AI Stock Screener & Alerts
Our new AI Stock Screener scans the market every day to uncover opportunities.
• Dividend Powerhouses (3%+ Yield)
• Undervalued Small Caps with Insider Buying
• High growth Tech and AI Companies
Or build your own from over 50 metrics.
Have feedback on this article? Concerned about the content? Get in touch with us directly. Alternatively, email editorial-team (at) simplywallst.com.
This article by Simply Wall St is general in nature. We provide commentary based on historical data and analyst forecasts only using an unbiased methodology and our articles are not intended to be financial advice. It does not constitute a recommendation to buy or sell any stock, and does not take account of your objectives, or your financial situation. We aim to bring you long-term focused analysis driven by fundamental data. Note that our analysis may not factor in the latest price-sensitive company announcements or qualitative material. Simply Wall St has no position in any stocks mentioned.
About SZSE:300299
Fuchun Technology
Provides network development, planning, designing, construction management, and business support services for communication operators, governments, and large enterprises in China.
Mediocre balance sheet minimal.
