
Advertisement
- China
- /
- Interactive Media and Services
- /
- SZSE:000681
These 4 Measures Indicate That Visual China GroupLtd (SZSE:000681) Is Using Debt Safely
Legendary fund manager Li Lu (who Charlie Munger backed) once said, 'The biggest investment risk is not the volatility of prices, but whether you will suffer a permanent loss of capital.' When we think about how risky a company is, we always like to look at its use of debt, since debt overload can lead to ruin. We can see that Visual China Group Co.,Ltd. (SZSE:000681) does use debt in its business. But should shareholders be worried about its use of debt?
When Is Debt A Problem?
Generally speaking, debt only becomes a real problem when a company can't easily pay it off, either by raising capital or with its own cash flow. If things get really bad, the lenders can take control of the business. However, a more common (but still painful) scenario is that it has to raise new equity capital at a low price, thus permanently diluting shareholders. Of course, debt can be an important tool in businesses, particularly capital heavy businesses. When we examine debt levels, we first consider both cash and debt levels, together.
See our latest analysis for Visual China GroupLtd
What Is Visual China GroupLtd's Debt?
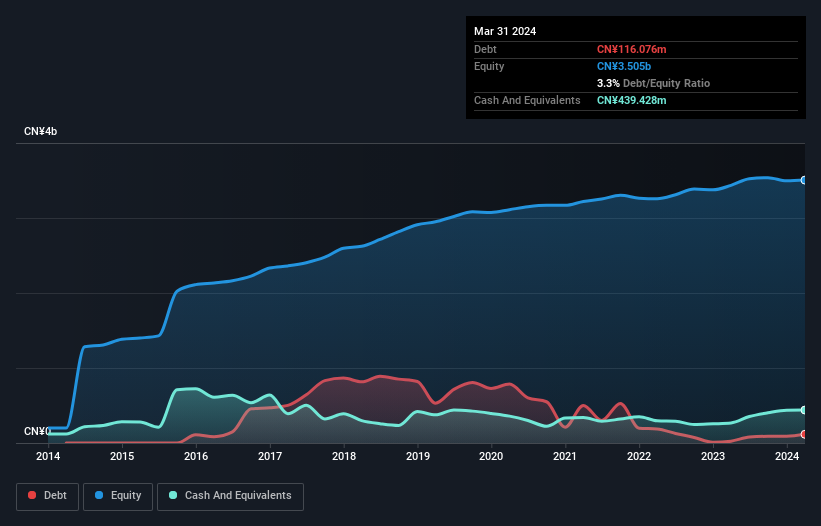
The image below, which you can click on for greater detail, shows that at March 2024 Visual China GroupLtd had debt of CN¥116.1m, up from CN¥24.4m in one year. However, its balance sheet shows it holds CN¥439.4m in cash, so it actually has CN¥323.4m net cash.
How Healthy Is Visual China GroupLtd's Balance Sheet?
Zooming in on the latest balance sheet data, we can see that Visual China GroupLtd had liabilities of CN¥455.4m due within 12 months and liabilities of CN¥228.2m due beyond that. Offsetting these obligations, it had cash of CN¥439.4m as well as receivables valued at CN¥208.6m due within 12 months. So its liabilities total CN¥35.5m more than the combination of its cash and short-term receivables.
This state of affairs indicates that Visual China GroupLtd's balance sheet looks quite solid, as its total liabilities are just about equal to its liquid assets. So it's very unlikely that the CN¥8.62b company is short on cash, but still worth keeping an eye on the balance sheet. Despite its noteworthy liabilities, Visual China GroupLtd boasts net cash, so it's fair to say it does not have a heavy debt load!
Better yet, Visual China GroupLtd grew its EBIT by 107% last year, which is an impressive improvement. That boost will make it even easier to pay down debt going forward. The balance sheet is clearly the area to focus on when you are analysing debt. But ultimately the future profitability of the business will decide if Visual China GroupLtd can strengthen its balance sheet over time. So if you want to see what the professionals think, you might find this free report on analyst profit forecasts to be interesting.
Finally, a company can only pay off debt with cold hard cash, not accounting profits. While Visual China GroupLtd has net cash on its balance sheet, it's still worth taking a look at its ability to convert earnings before interest and tax (EBIT) to free cash flow, to help us understand how quickly it is building (or eroding) that cash balance. Happily for any shareholders, Visual China GroupLtd actually produced more free cash flow than EBIT over the last three years. There's nothing better than incoming cash when it comes to staying in your lenders' good graces.
Summing Up
While it is always sensible to look at a company's total liabilities, it is very reassuring that Visual China GroupLtd has CN¥323.4m in net cash. And it impressed us with free cash flow of CN¥154m, being 121% of its EBIT. So is Visual China GroupLtd's debt a risk? It doesn't seem so to us. When analysing debt levels, the balance sheet is the obvious place to start. But ultimately, every company can contain risks that exist outside of the balance sheet. Case in point: We've spotted 1 warning sign for Visual China GroupLtd you should be aware of.
If, after all that, you're more interested in a fast growing company with a rock-solid balance sheet, then check out our list of net cash growth stocks without delay.
New: Manage All Your Stock Portfolios in One Place
We've created the ultimate portfolio companion for stock investors, and it's free.
• Connect an unlimited number of Portfolios and see your total in one currency
• Be alerted to new Warning Signs or Risks via email or mobile
• Track the Fair Value of your stocks
Have feedback on this article? Concerned about the content? Get in touch with us directly. Alternatively, email editorial-team (at) simplywallst.com.
This article by Simply Wall St is general in nature. We provide commentary based on historical data and analyst forecasts only using an unbiased methodology and our articles are not intended to be financial advice. It does not constitute a recommendation to buy or sell any stock, and does not take account of your objectives, or your financial situation. We aim to bring you long-term focused analysis driven by fundamental data. Note that our analysis may not factor in the latest price-sensitive company announcements or qualitative material. Simply Wall St has no position in any stocks mentioned.
About SZSE:000681
Visual China GroupLtd
Provides internet media and other services in China and internationally.
Flawless balance sheet with proven track record.
Similar Companies
Market Insights

Advertisement
Weekly Picks
FA

FAI on Arabian Internet and Communication Services ·
Solutions by stc: 34% Upside in Saudi's Digital Transformation Leader
Fair Value:ر.س342.2335.3% undervalued
9 followersusers have followed this narrative
1 commentusers have commented on this narrative
3 likesusers have liked this narrative
RO


RobertoAllende on NVIDIA ·
The AI Infrastructure Giant Grows Into Its Valuation
Fair Value:US$345.0747.9% undervalued
27 followersusers have followed this narrative
28 commentsusers have commented on this narrative
21 likesusers have liked this narrative
Recently Updated Narratives
AB
Abc on Global X Etfs Icav - Global X Silver Miners Ucits ETF ·
Many trends acting at the same time
Fair Value:€10068.5% undervalued
1 followerusers have followed this narrative
0 commentsusers have commented on this narrative
0 likesusers have liked this narrative
NI


niteco on Texas Instruments ·
Engineered for Stability. Positioned for Growth.
Fair Value:US$314.4446.5% undervalued
2 followersusers have followed this narrative
0 commentsusers have commented on this narrative
0 likesusers have liked this narrative
MA


MarkoVT on Applied Digital ·
Staggered by dilution; positions for growth
Fair Value:US$35.4520.4% undervalued
2 followersusers have followed this narrative
0 commentsusers have commented on this narrative
0 likesusers have liked this narrative
Popular Narratives
TH

TheWallstreetKing on MicroVision ·
MicroVision will explode future revenue by 380.37% with a vision towards success
Fair Value:US$6098.4% undervalued
109 followersusers have followed this narrative
11 commentsusers have commented on this narrative
22 likesusers have liked this narrative
AN

AnalystConsensusTarget on NVIDIA ·
NVDA: Expanding AI Demand Will Drive Major Data Center Investments Through 2026
Fair Value:US$250.3928.1% undervalued
939 followersusers have followed this narrative
6 commentsusers have commented on this narrative
24 likesusers have liked this narrative
OS


oscargarcia on Alphabet ·
The company that turned a verb into a global necessity and basically runs the modern internet, digital ads, smartphones, maps, and AI.
Fair Value:US$3407.4% undervalued
145 followersusers have followed this narrative
6 commentsusers have commented on this narrative
18 likesusers have liked this narrative