
Advertisement
Calculating The Fair Value Of Jiangsu Huaxin New Material Co.,Ltd. (SZSE:300717)

Key Insights
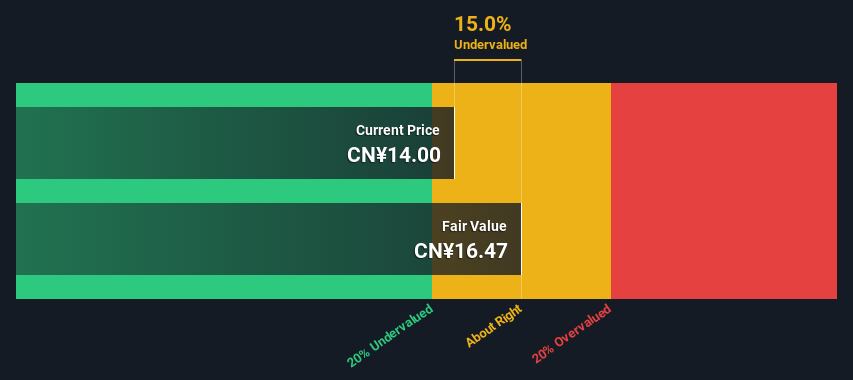
- Jiangsu Huaxin New MaterialLtd's estimated fair value is CN¥16.47 based on 2 Stage Free Cash Flow to Equity
- With CN¥14.00 share price, Jiangsu Huaxin New MaterialLtd appears to be trading close to its estimated fair value
- The average premium for Jiangsu Huaxin New MaterialLtd's competitorsis currently 2,184%
Today we will run through one way of estimating the intrinsic value of Jiangsu Huaxin New Material Co.,Ltd. (SZSE:300717) by projecting its future cash flows and then discounting them to today's value. Our analysis will employ the Discounted Cash Flow (DCF) model. It may sound complicated, but actually it is quite simple!
Remember though, that there are many ways to estimate a company's value, and a DCF is just one method. For those who are keen learners of equity analysis, the Simply Wall St analysis model here may be something of interest to you.
View our latest analysis for Jiangsu Huaxin New MaterialLtd
The Method
We use what is known as a 2-stage model, which simply means we have two different periods of growth rates for the company's cash flows. Generally the first stage is higher growth, and the second stage is a lower growth phase. In the first stage we need to estimate the cash flows to the business over the next ten years. Seeing as no analyst estimates of free cash flow are available to us, we have extrapolate the previous free cash flow (FCF) from the company's last reported value. We assume companies with shrinking free cash flow will slow their rate of shrinkage, and that companies with growing free cash flow will see their growth rate slow, over this period. We do this to reflect that growth tends to slow more in the early years than it does in later years.
Generally we assume that a dollar today is more valuable than a dollar in the future, so we discount the value of these future cash flows to their estimated value in today's dollars:
10-year free cash flow (FCF) forecast
| 2025 | 2026 | 2027 | 2028 | 2029 | 2030 | 2031 | 2032 | 2033 | 2034 | |
| Levered FCF (CN¥, Millions) | CN¥53.0m | CN¥62.6m | CN¥71.0m | CN¥78.2m | CN¥84.5m | CN¥90.0m | CN¥94.9m | CN¥99.3m | CN¥103.3m | CN¥107.2m |
| Growth Rate Estimate Source | Est @ 24.45% | Est @ 17.97% | Est @ 13.44% | Est @ 10.26% | Est @ 8.04% | Est @ 6.48% | Est @ 5.39% | Est @ 4.63% | Est @ 4.10% | Est @ 3.72% |
| Present Value (CN¥, Millions) Discounted @ 7.5% | CN¥49.3 | CN¥54.1 | CN¥57.1 | CN¥58.5 | CN¥58.8 | CN¥58.2 | CN¥57.1 | CN¥55.5 | CN¥53.7 | CN¥51.8 |
("Est" = FCF growth rate estimated by Simply Wall St)
Present Value of 10-year Cash Flow (PVCF) = CN¥554m
The second stage is also known as Terminal Value, this is the business's cash flow after the first stage. The Gordon Growth formula is used to calculate Terminal Value at a future annual growth rate equal to the 5-year average of the 10-year government bond yield of 2.9%. We discount the terminal cash flows to today's value at a cost of equity of 7.5%.
Terminal Value (TV)= FCF2034 × (1 + g) ÷ (r – g) = CN¥107m× (1 + 2.9%) ÷ (7.5%– 2.9%) = CN¥2.4b
Present Value of Terminal Value (PVTV)= TV / (1 + r)10= CN¥2.4b÷ ( 1 + 7.5%)10= CN¥1.1b
The total value is the sum of cash flows for the next ten years plus the discounted terminal value, which results in the Total Equity Value, which in this case is CN¥1.7b. To get the intrinsic value per share, we divide this by the total number of shares outstanding. Compared to the current share price of CN¥14.0, the company appears about fair value at a 15% discount to where the stock price trades currently. Remember though, that this is just an approximate valuation, and like any complex formula - garbage in, garbage out.
Important Assumptions
The calculation above is very dependent on two assumptions. The first is the discount rate and the other is the cash flows. You don't have to agree with these inputs, I recommend redoing the calculations yourself and playing with them. The DCF also does not consider the possible cyclicality of an industry, or a company's future capital requirements, so it does not give a full picture of a company's potential performance. Given that we are looking at Jiangsu Huaxin New MaterialLtd as potential shareholders, the cost of equity is used as the discount rate, rather than the cost of capital (or weighted average cost of capital, WACC) which accounts for debt. In this calculation we've used 7.5%, which is based on a levered beta of 0.940. Beta is a measure of a stock's volatility, compared to the market as a whole. We get our beta from the industry average beta of globally comparable companies, with an imposed limit between 0.8 and 2.0, which is a reasonable range for a stable business.
SWOT Analysis for Jiangsu Huaxin New MaterialLtd
Strength
- Earnings growth over the past year exceeded the industry.
- Currently debt free.
- Dividends are covered by earnings and cash flows.
Weakness
- Dividend is low compared to the top 25% of dividend payers in the Chemicals market.
Opportunity
- Current share price is below our estimate of fair value.
- Lack of analyst coverage makes it difficult to determine 300717's earnings prospects.
Threat
- No apparent threats visible for 300717.
Looking Ahead:
Valuation is only one side of the coin in terms of building your investment thesis, and it shouldn't be the only metric you look at when researching a company. The DCF model is not a perfect stock valuation tool. Rather it should be seen as a guide to "what assumptions need to be true for this stock to be under/overvalued?" For example, changes in the company's cost of equity or the risk free rate can significantly impact the valuation. For Jiangsu Huaxin New MaterialLtd, we've put together three fundamental elements you should assess:
- Risks: As an example, we've found 2 warning signs for Jiangsu Huaxin New MaterialLtd (1 is significant!) that you need to consider before investing here.
- Other Solid Businesses: Low debt, high returns on equity and good past performance are fundamental to a strong business. Why not explore our interactive list of stocks with solid business fundamentals to see if there are other companies you may not have considered!
- Other Top Analyst Picks: Interested to see what the analysts are thinking? Take a look at our interactive list of analysts' top stock picks to find out what they feel might have an attractive future outlook!
PS. The Simply Wall St app conducts a discounted cash flow valuation for every stock on the SZSE every day. If you want to find the calculation for other stocks just search here.
New: Manage All Your Stock Portfolios in One Place
We've created the ultimate portfolio companion for stock investors, and it's free.
• Connect an unlimited number of Portfolios and see your total in one currency
• Be alerted to new Warning Signs or Risks via email or mobile
• Track the Fair Value of your stocks
Have feedback on this article? Concerned about the content? Get in touch with us directly. Alternatively, email editorial-team (at) simplywallst.com.
This article by Simply Wall St is general in nature. We provide commentary based on historical data and analyst forecasts only using an unbiased methodology and our articles are not intended to be financial advice. It does not constitute a recommendation to buy or sell any stock, and does not take account of your objectives, or your financial situation. We aim to bring you long-term focused analysis driven by fundamental data. Note that our analysis may not factor in the latest price-sensitive company announcements or qualitative material. Simply Wall St has no position in any stocks mentioned.
About SZSE:300717
Jiangsu Huaxin New MaterialLtd
Engages in the research, development, production, and sale of functional film materials.
Excellent balance sheet with proven track record.
Market Insights

Advertisement
Community Narratives
Scaling up in building materials with smart M&A and growing profitability
Fair Value US$2.77|30.0% undervalued
CM
Community Contributor
Hims: The Platform Powering Personalised Healthcare
Fair Value US$114.01|51.9% undervalued
BL
Community Contributor
Undervalued lottery company with strong fundamentals
Fair Value AU$15.00|34.5% undervalued
RO
Community Contributor
Proximus, transferring money from the impatient to the patient investor
Fair Value €16.62|55.1% undervalued
AX
Community Contributor