
Advertisement
Jiangmen Kanhoo Industry Co., Ltd (SZSE:300340) Held Back By Insufficient Growth Even After Shares Climb 25%

Jiangmen Kanhoo Industry Co., Ltd (SZSE:300340) shareholders are no doubt pleased to see that the share price has bounced 25% in the last month, although it is still struggling to make up recently lost ground. Looking back a bit further, it's encouraging to see the stock is up 37% in the last year.
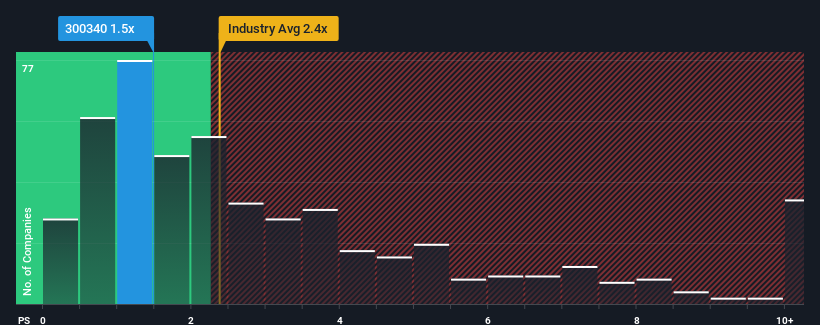
In spite of the firm bounce in price, Jiangmen Kanhoo Industry may still be sending bullish signals at the moment with its price-to-sales (or "P/S") ratio of 1.5x, since almost half of all companies in the Chemicals industry in China have P/S ratios greater than 2.4x and even P/S higher than 5x are not unusual. Although, it's not wise to just take the P/S at face value as there may be an explanation why it's limited.
Check out our latest analysis for Jiangmen Kanhoo Industry
How Jiangmen Kanhoo Industry Has Been Performing
For example, consider that Jiangmen Kanhoo Industry's financial performance has been poor lately as its revenue has been in decline. It might be that many expect the disappointing revenue performance to continue or accelerate, which has repressed the P/S. Those who are bullish on Jiangmen Kanhoo Industry will be hoping that this isn't the case so that they can pick up the stock at a lower valuation.
Although there are no analyst estimates available for Jiangmen Kanhoo Industry, take a look at this free data-rich visualisation to see how the company stacks up on earnings, revenue and cash flow.Is There Any Revenue Growth Forecasted For Jiangmen Kanhoo Industry?
Jiangmen Kanhoo Industry's P/S ratio would be typical for a company that's only expected to deliver limited growth, and importantly, perform worse than the industry.
In reviewing the last year of financials, we were disheartened to see the company's revenues fell to the tune of 40%. The last three years don't look nice either as the company has shrunk revenue by 22% in aggregate. So unfortunately, we have to acknowledge that the company has not done a great job of growing revenue over that time.
Comparing that to the industry, which is predicted to deliver 25% growth in the next 12 months, the company's downward momentum based on recent medium-term revenue results is a sobering picture.
With this in mind, we understand why Jiangmen Kanhoo Industry's P/S is lower than most of its industry peers. However, we think shrinking revenues are unlikely to lead to a stable P/S over the longer term, which could set up shareholders for future disappointment. Even just maintaining these prices could be difficult to achieve as recent revenue trends are already weighing down the shares.
What Does Jiangmen Kanhoo Industry's P/S Mean For Investors?
Despite Jiangmen Kanhoo Industry's share price climbing recently, its P/S still lags most other companies. We'd say the price-to-sales ratio's power isn't primarily as a valuation instrument but rather to gauge current investor sentiment and future expectations.
Our examination of Jiangmen Kanhoo Industry confirms that the company's shrinking revenue over the past medium-term is a key factor in its low price-to-sales ratio, given the industry is projected to grow. Right now shareholders are accepting the low P/S as they concede future revenue probably won't provide any pleasant surprises either. Unless the recent medium-term conditions improve, they will continue to form a barrier for the share price around these levels.
You should always think about risks. Case in point, we've spotted 1 warning sign for Jiangmen Kanhoo Industry you should be aware of.
If these risks are making you reconsider your opinion on Jiangmen Kanhoo Industry, explore our interactive list of high quality stocks to get an idea of what else is out there.
New: Manage All Your Stock Portfolios in One Place
We've created the ultimate portfolio companion for stock investors, and it's free.
• Connect an unlimited number of Portfolios and see your total in one currency
• Be alerted to new Warning Signs or Risks via email or mobile
• Track the Fair Value of your stocks
Have feedback on this article? Concerned about the content? Get in touch with us directly. Alternatively, email editorial-team (at) simplywallst.com.
This article by Simply Wall St is general in nature. We provide commentary based on historical data and analyst forecasts only using an unbiased methodology and our articles are not intended to be financial advice. It does not constitute a recommendation to buy or sell any stock, and does not take account of your objectives, or your financial situation. We aim to bring you long-term focused analysis driven by fundamental data. Note that our analysis may not factor in the latest price-sensitive company announcements or qualitative material. Simply Wall St has no position in any stocks mentioned.
About SZSE:300340
Jiangmen Kanhoo Industry
Engages in the development, production, and manufacture of cathode materials in China.
Good value with mediocre balance sheet.
Market Insights

Advertisement
Community Narratives
Scaling up in building materials with smart M&A and growing profitability
Fair Value US$2.77|31.0% undervalued
CM
Community Contributor
Hims: The Platform Powering Personalised Healthcare
Fair Value US$114.01|53.1% undervalued
BL
Community Contributor
Undervalued lottery company with strong fundamentals
Fair Value AU$15.00|34.5% undervalued
RO
Community Contributor
Proximus, transferring money from the impatient to the patient investor
Fair Value €16.62|54.5% undervalued
AX
Community Contributor